

Description
The “Table Comparison Icon PowerPoint Presentation slide template” is a meticulously designed PPT template crafted to facilitate the clear and effective presentation of comparative data. This essential presentation tool is ideal for educators, business professionals, and advocates who frequently engage in data-driven storytelling and need to communicate complex information in an accessible format.
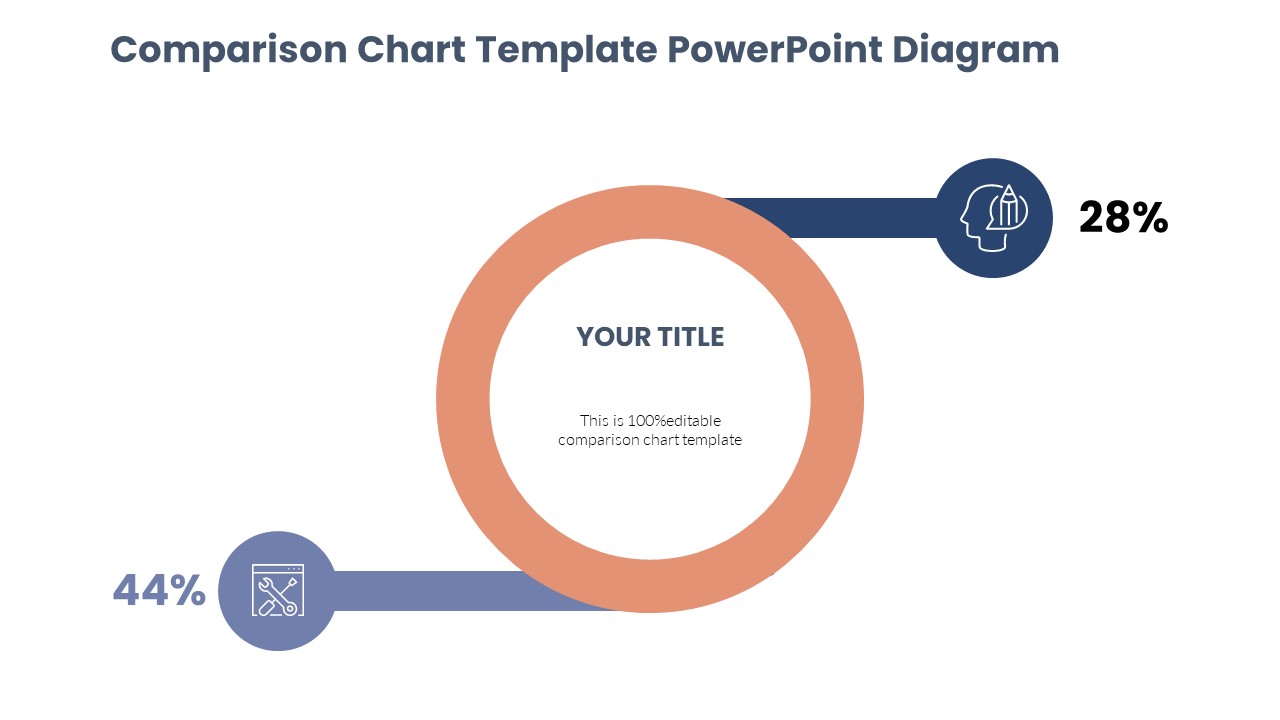
This PPT template is tailored to aid users in presenting comparisons in a structured table format, highlighting key differences and similarities between multiple datasets, products, or strategies. Each slide in the Table Comparison Icon PowerPoint Presentation PPT template features a clean, professional design with customizable icons and text areas to suit various content needs and presentation styles.
The user-friendly layout is designed to enhance audience understanding and retention of information, making it an invaluable asset for anyone looking to convey comparative analyses with clarity and precision. Whether you are a teacher illustrating different historical events, a business analyst comparing financial scenarios, or a policy advocate discussing varied approaches to an issue, this presentation template provides the tools you need to make your data stand out.
Additionally, the design elements in the “Table Comparison Icon PowerPoint Presentation slide template” are fully customizable, allowing users to tailor the aesthetics to fit their specific professional or educational context. The adaptability of this PPT slide makes it a versatile choice for a wide array of presentations where data comparison is key.
Features:
– Fully editable templates: Customize every element of the slides with ease.
– High-quality icons and graphics: Enhance visual appeal and convey information effectively.
– Compatibility with PowerPoint and Google Slides: Ensures a smooth user experience across different platforms.
– Multiple layout options: Choose from a variety of designs to best suit your data comparison needs.
– Easy-to-use design: Simplifies the process of creating professional and impactful presentations.
Use Cases:
– Ideal for educators explaining complex topics with comparative data.
– Perfect for business presentations involving market analysis or product comparisons.
– Essential for non-profit organizations to present comparative studies or progress reports.
– Useful for governmental presentations detailing policy impacts or legislative comparisons.
– Beneficial for conferences and seminars where data needs to be presented in a clear and comparative manner.


There are no reviews yet.