

Venn Diagrams

Venn diagram PowerPoint presentations are versatile visual aids used to showcase relationships, intersections, and comparisons between different sets of data, concepts, or elements. These presentations employ Venn diagrams, which consist of overlapping circles or shapes, to illustrate the overlap and distinctions among various categories, attributes, or criteria.
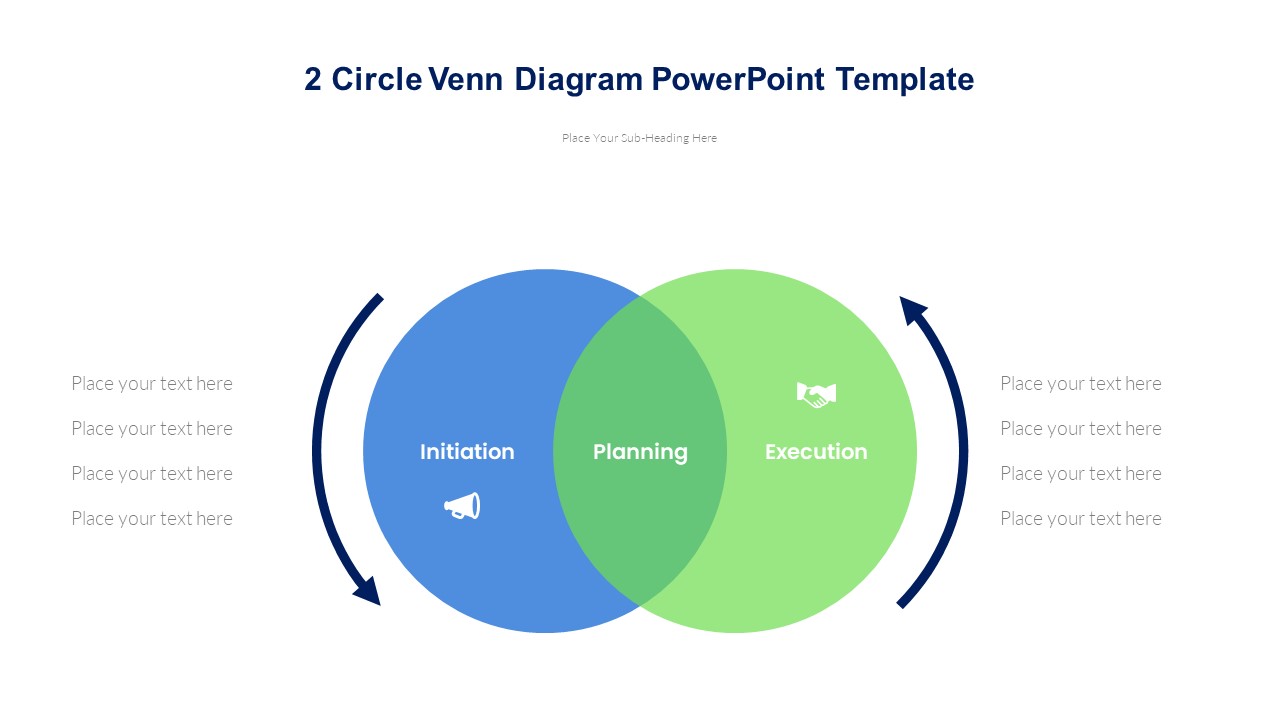
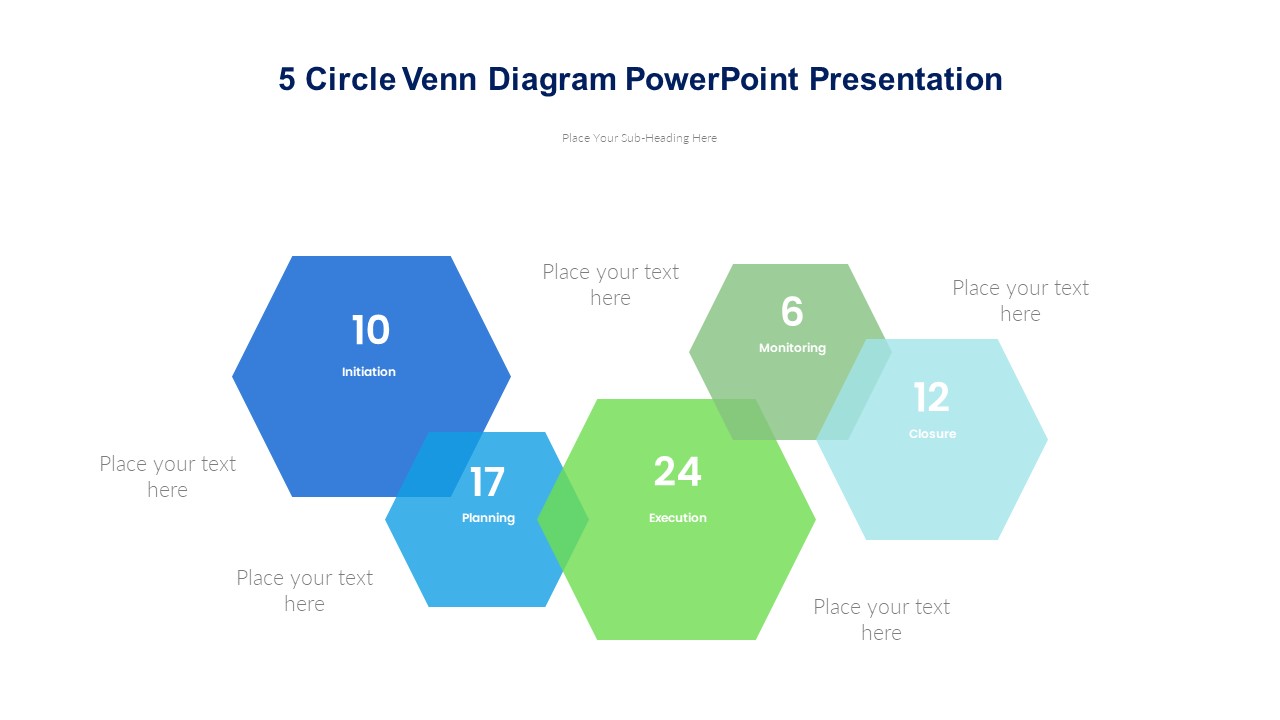
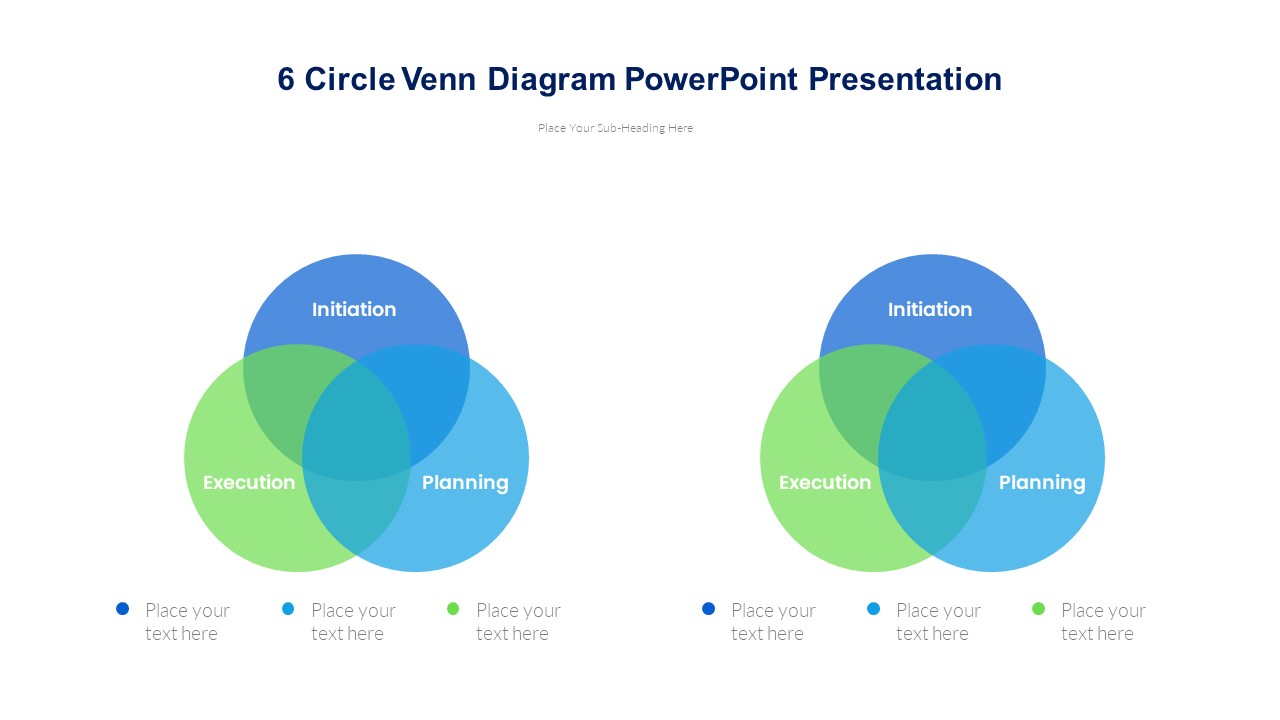
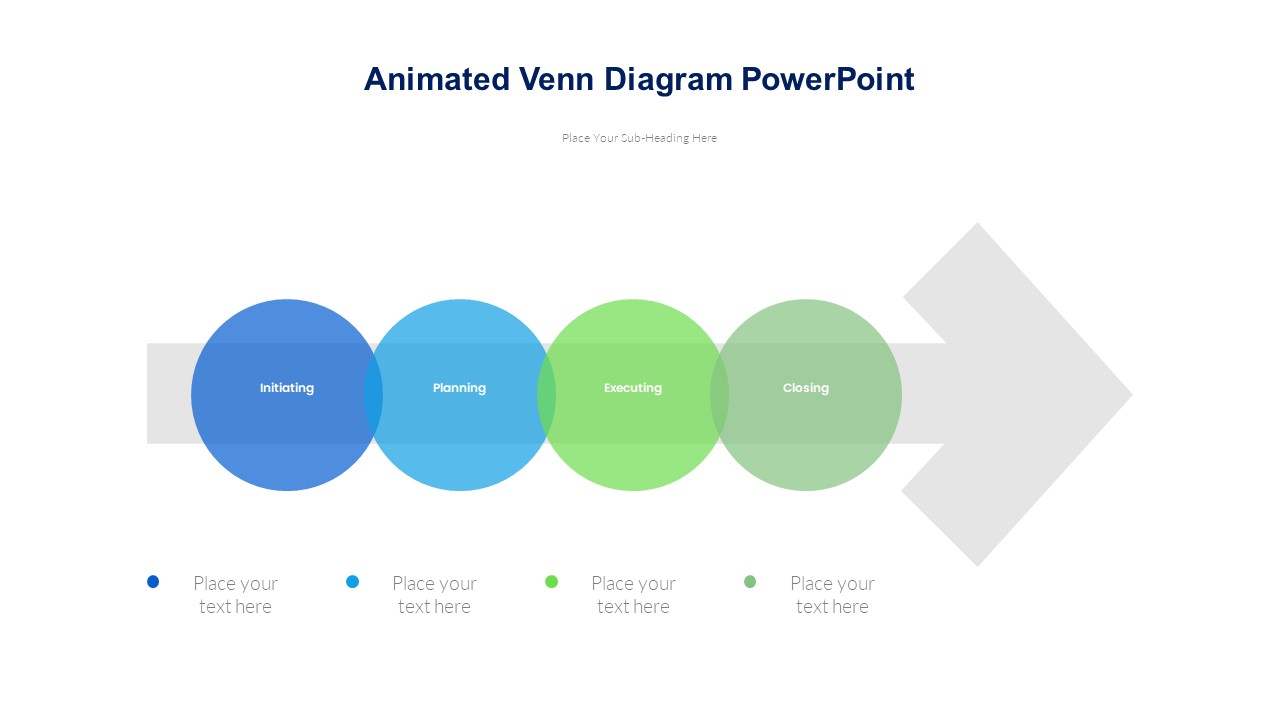
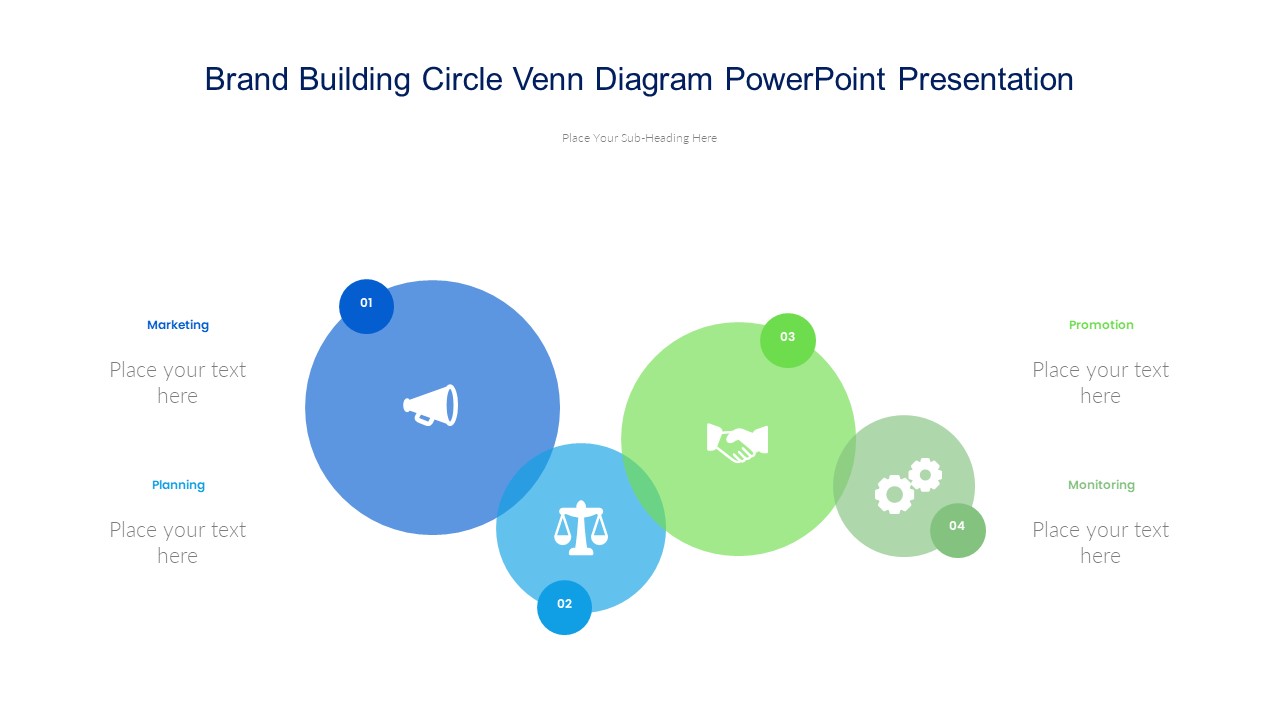
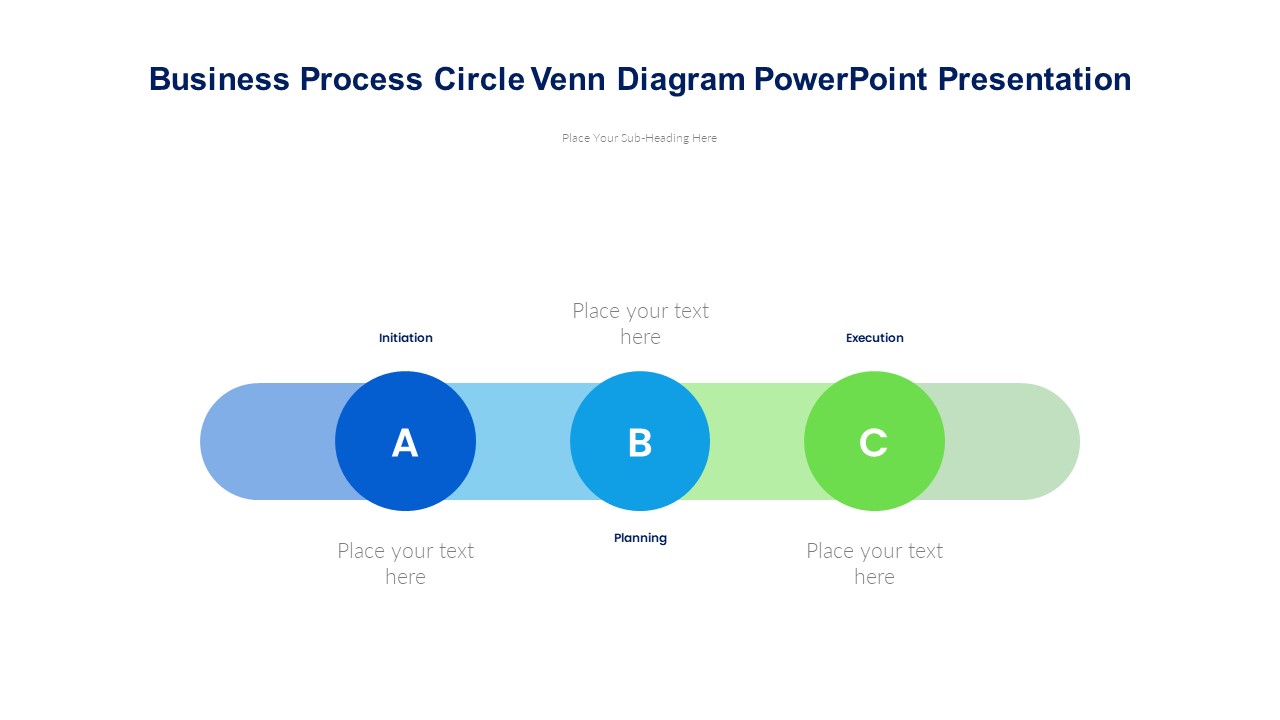
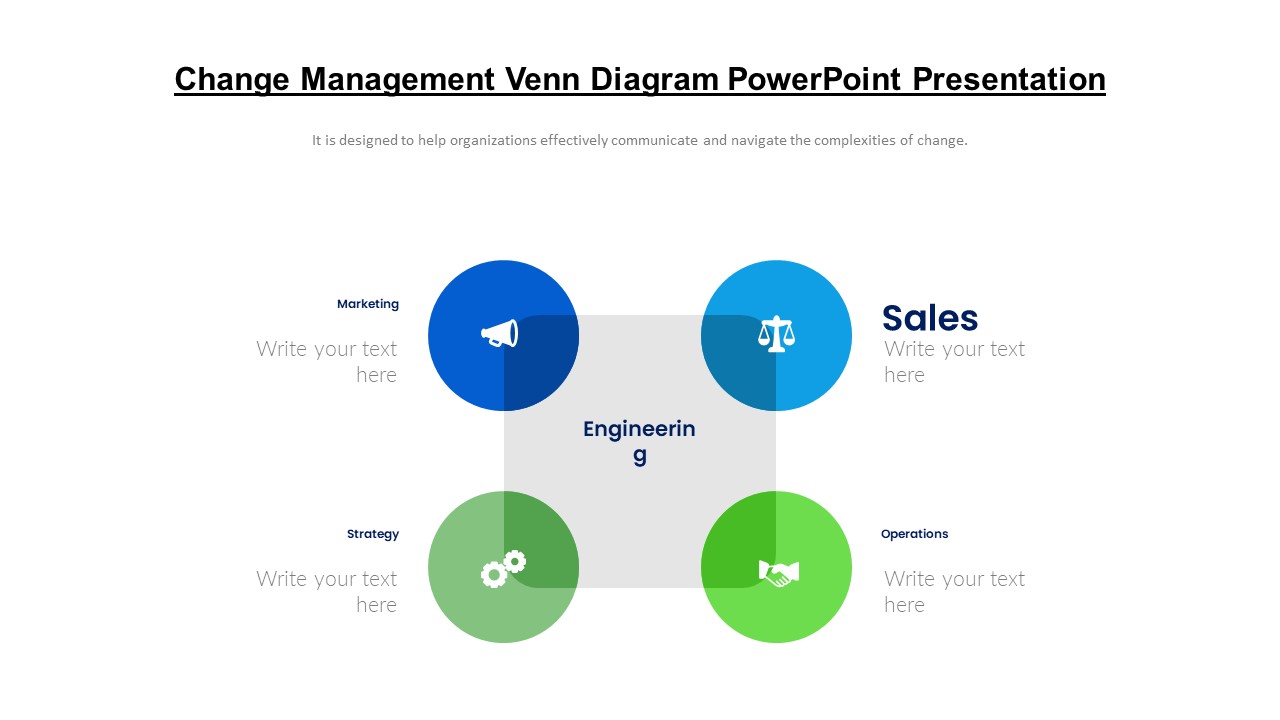
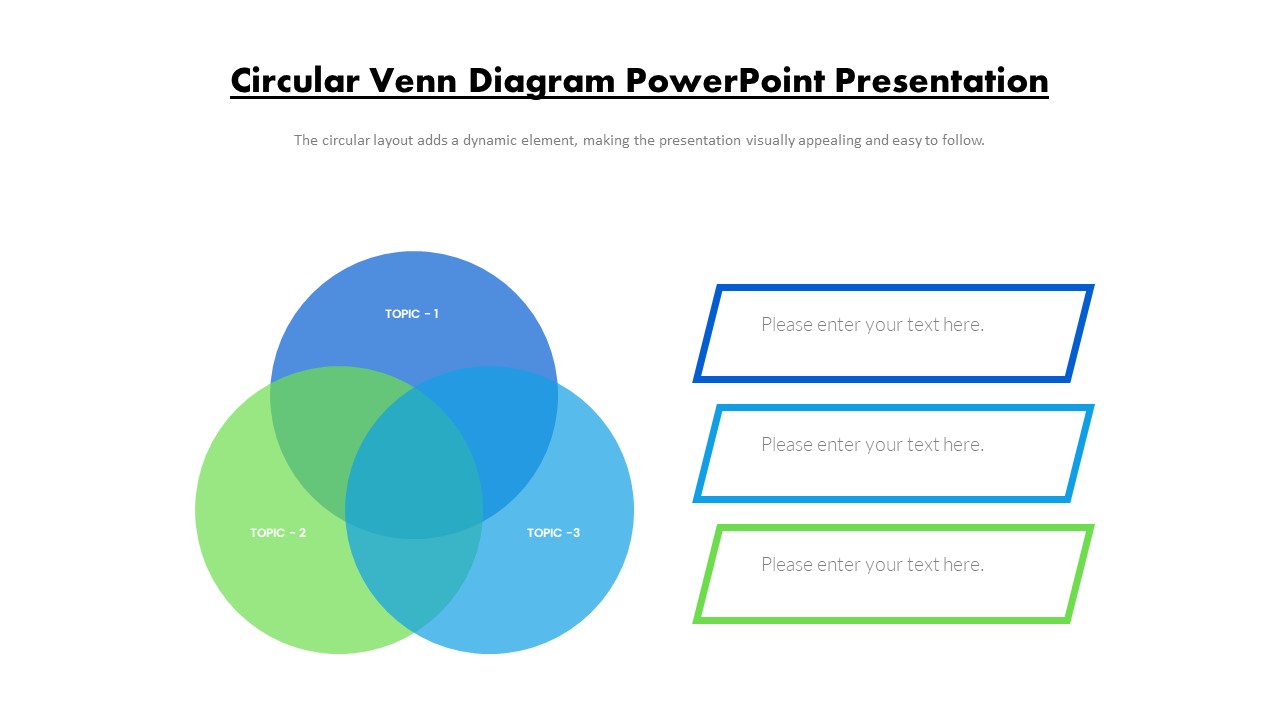
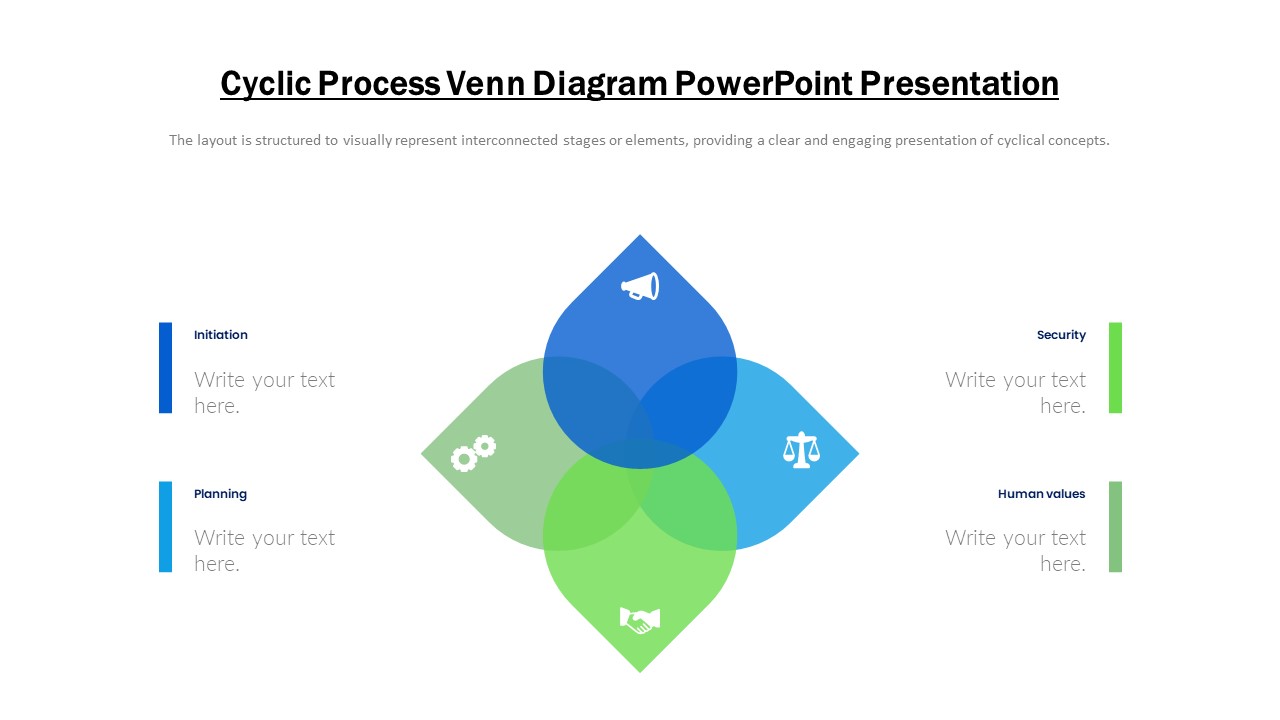
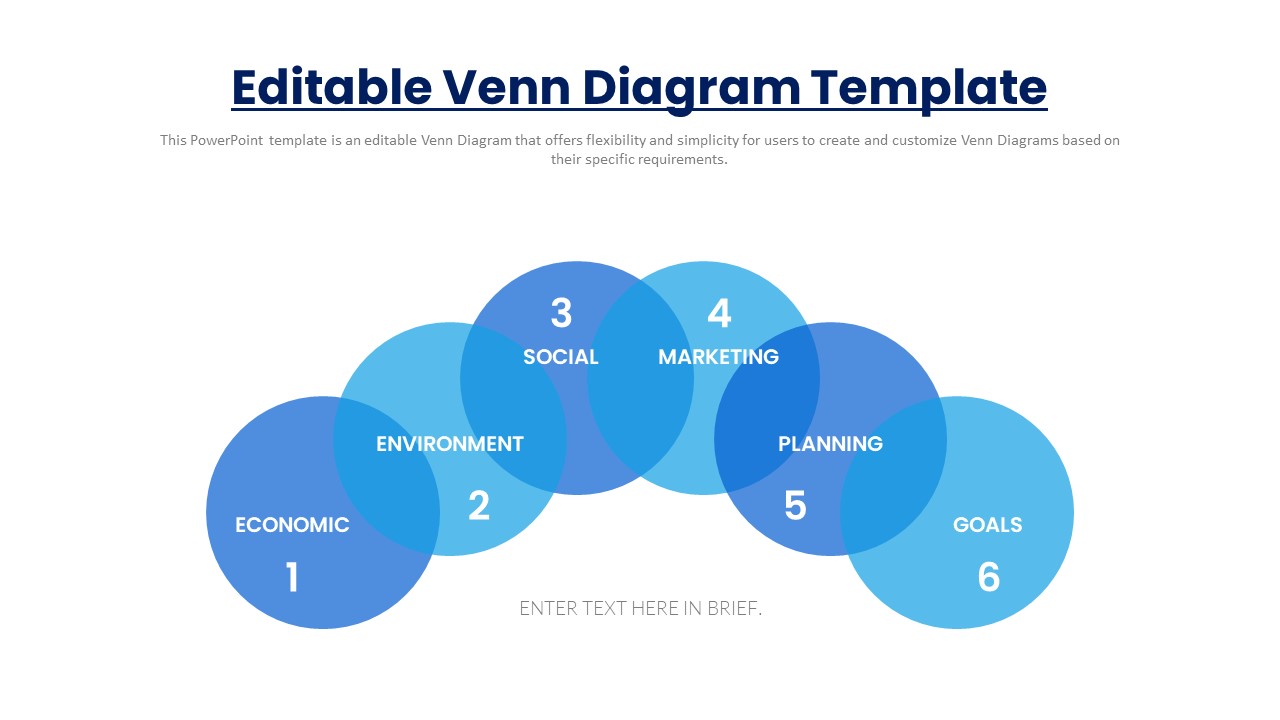
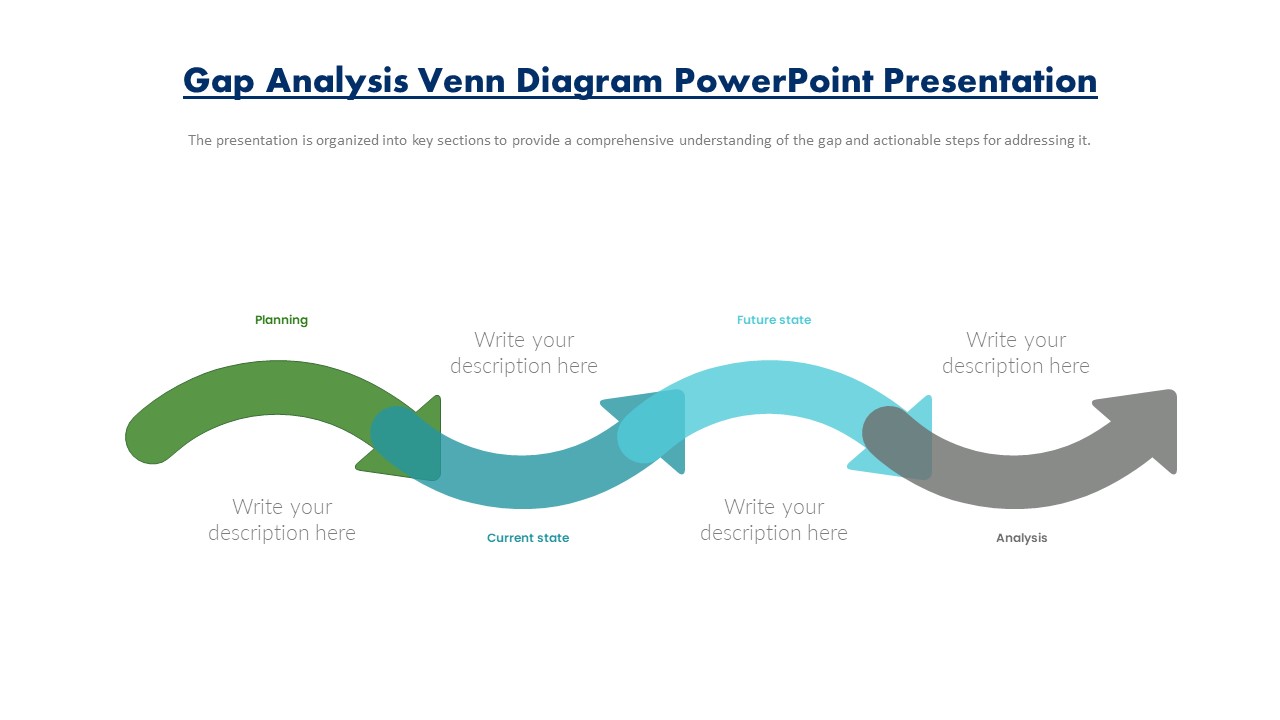
Venn diagram PowerPoint presentations typically feature slides with visually appealing Venn diagrams, each representing a unique comparison or analysis. These diagrams may range from simple two-set Venn diagrams to more complex arrangements involving multiple sets, enabling presenters to convey nuanced relationships and insights effectively.
These presentations are invaluable for professionals across various disciplines, including business, education, research, and marketing, as they provide a clear and concise way to visualize complex relationships and make informed decisions. Venn diagram PowerPoint presentations are commonly used for data analysis, market segmentation, feature comparison, problem-solving, and decision-making processes.
Venn diagram PowerPoint presentations facilitate audience engagement and comprehension by presenting information in a structured and visually appealing format. They enable presenters to highlight similarities, differences, overlaps, and exclusions among different sets, guiding viewers towards a deeper understanding of the underlying concepts or data.
Additionally, Venn diagram PowerPoint presentations can be customized with colors, labels, and annotations to suit the specific needs and preferences of the presenter or audience. They serve as dynamic tools for presenting information, facilitating discussions, and driving insights in various professional settings.