

Flow Chart
Flowchart PowerPoint presentations and slides are visual presentation used to illustrate processes, workflows, decision trees, and organizational structures in a clear and concise manner. These presentations are valuable for communicating complex information, guiding decision-making, and enhancing understanding across various industries and disciplines.
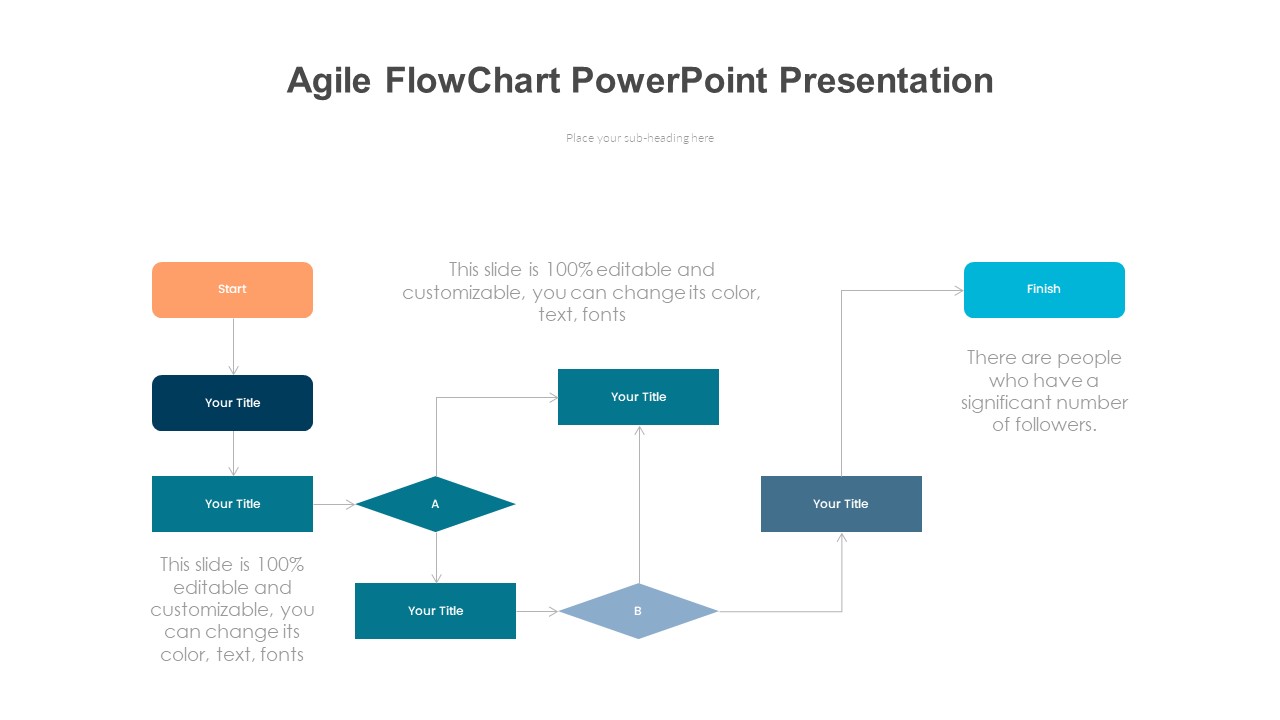
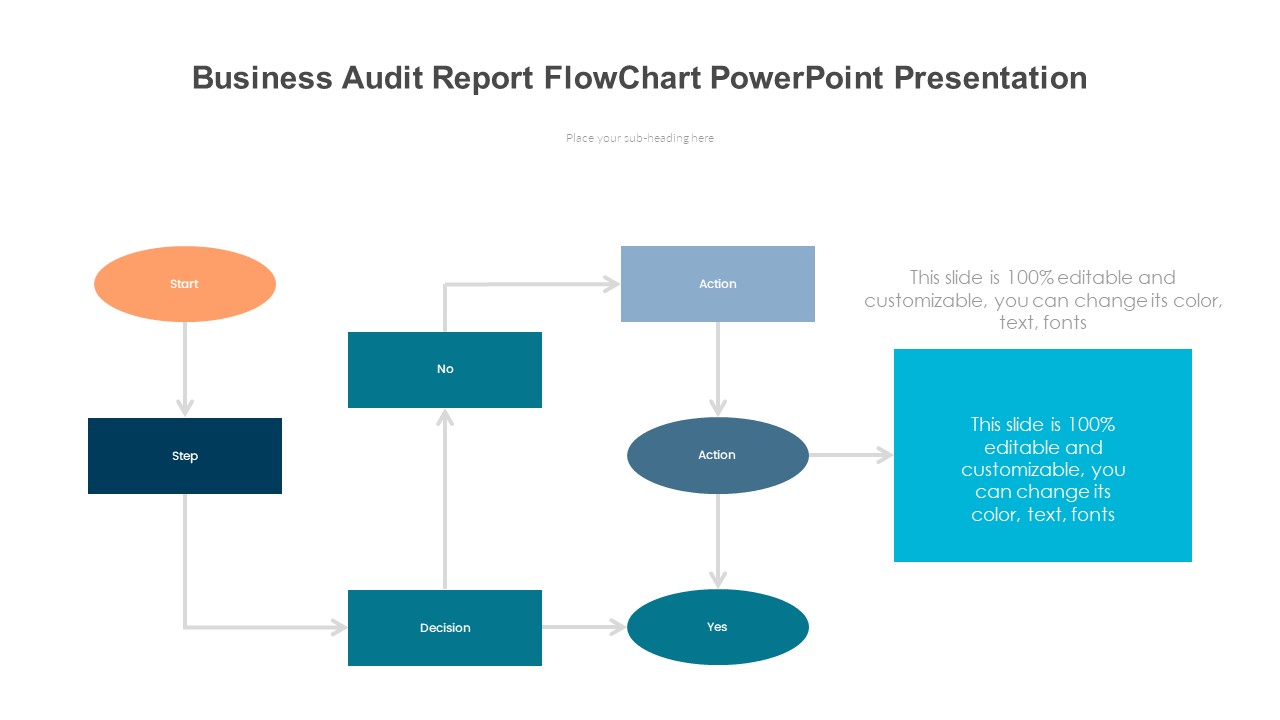
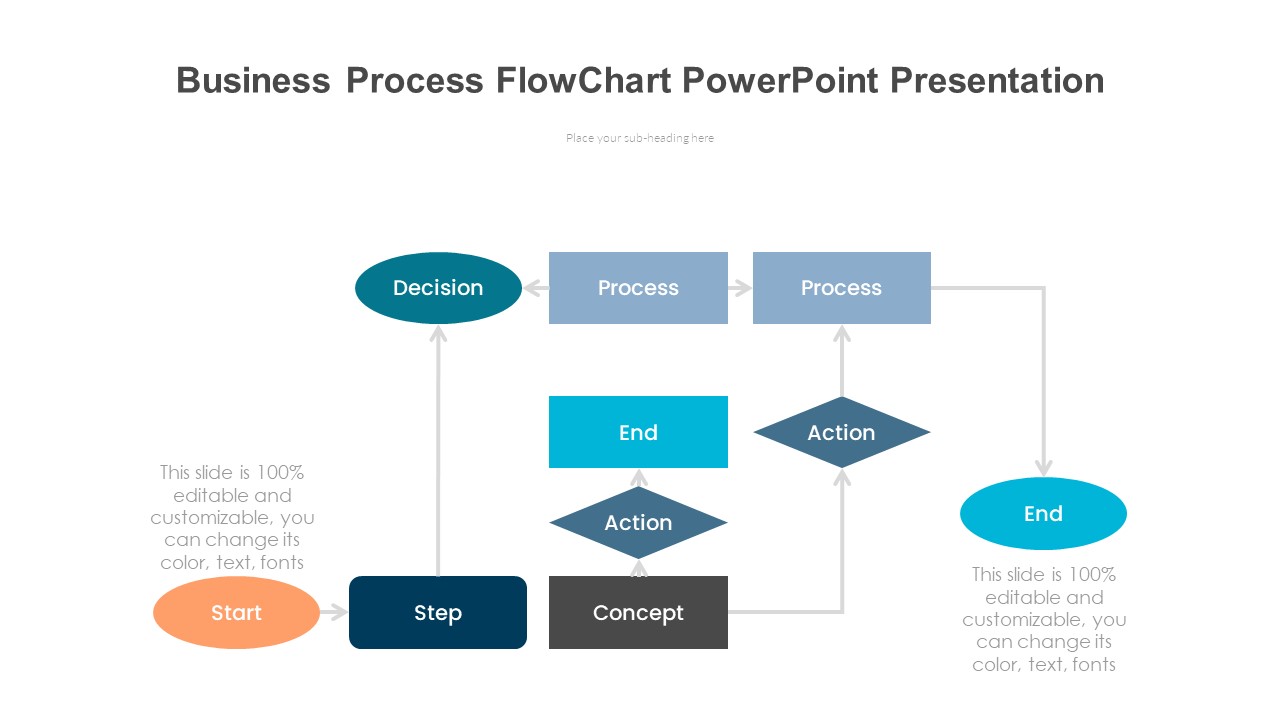
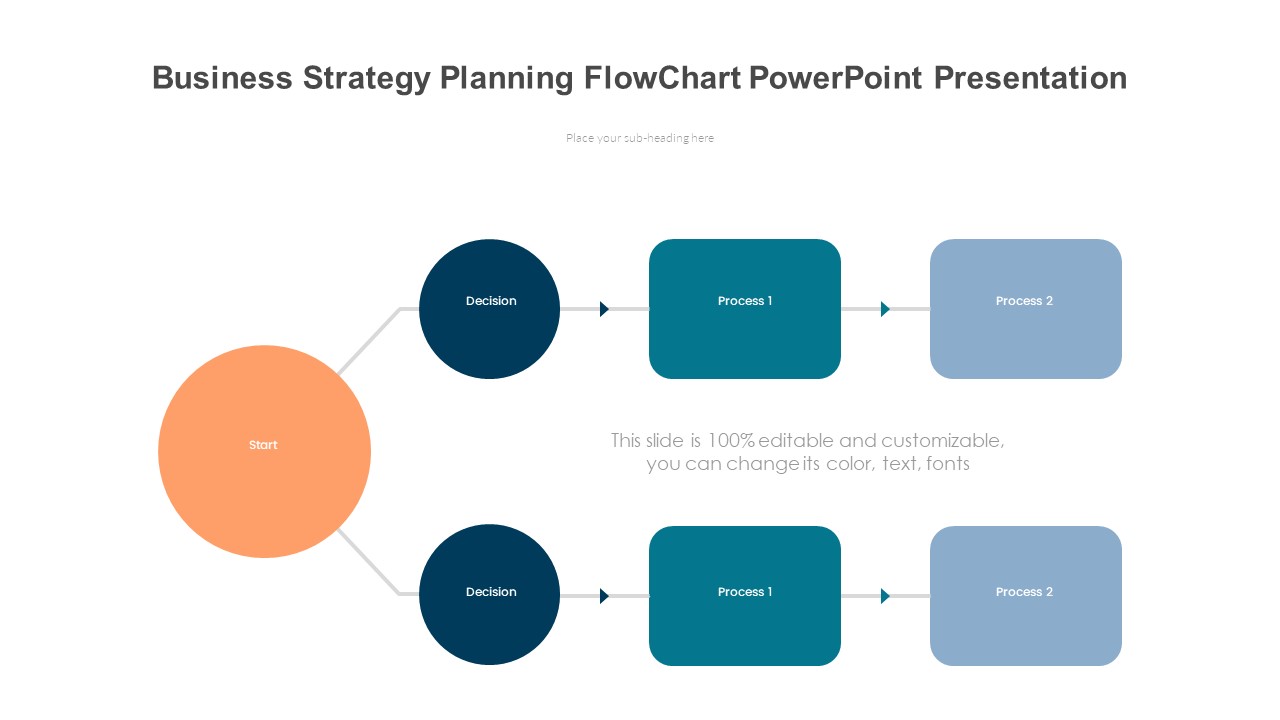
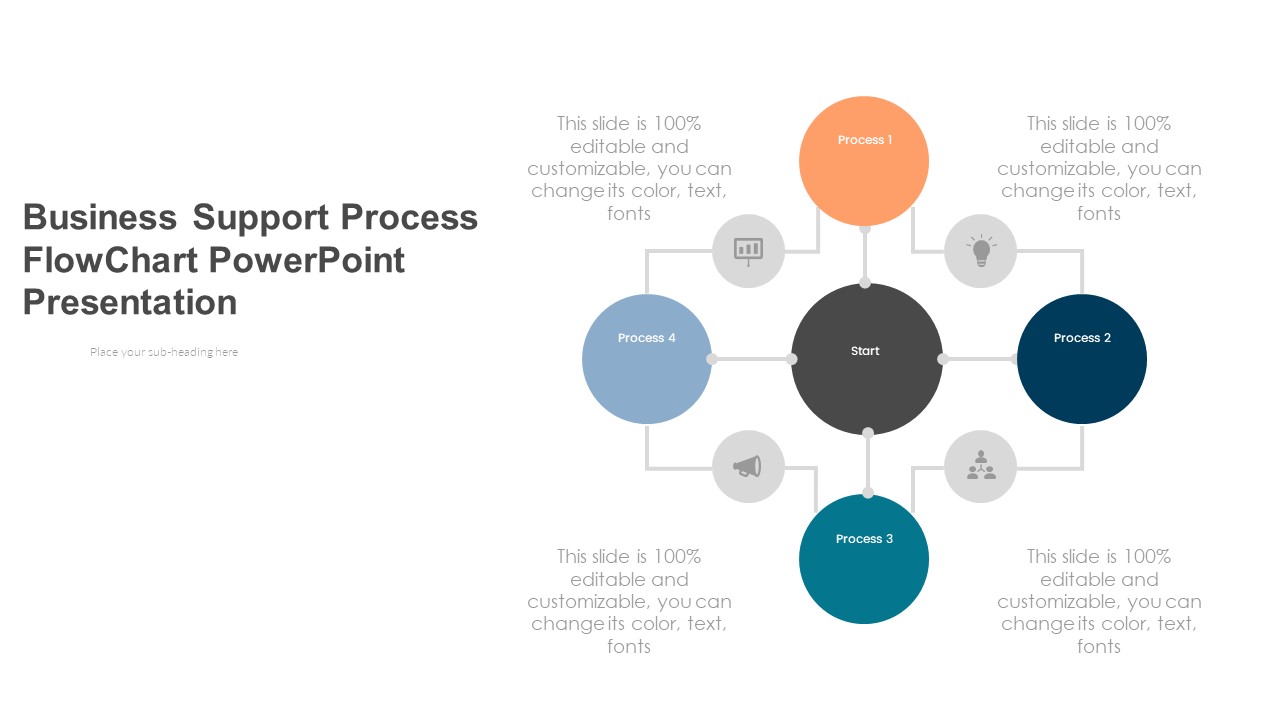
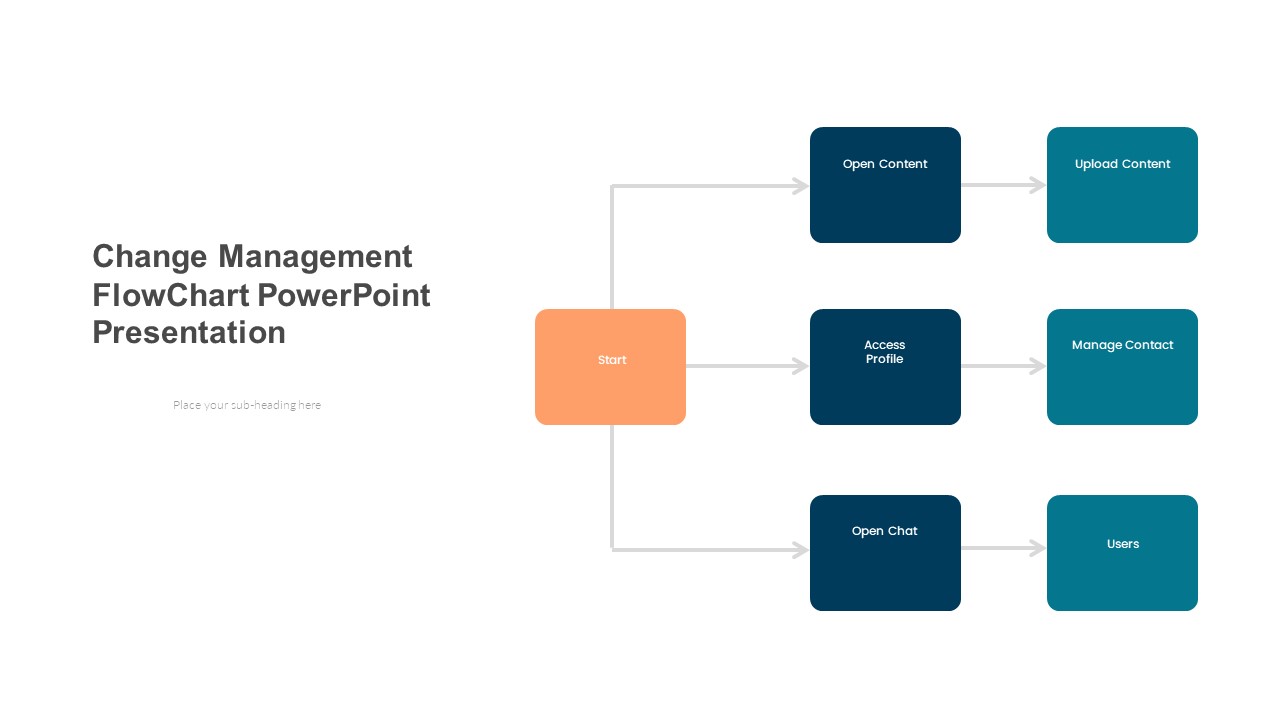
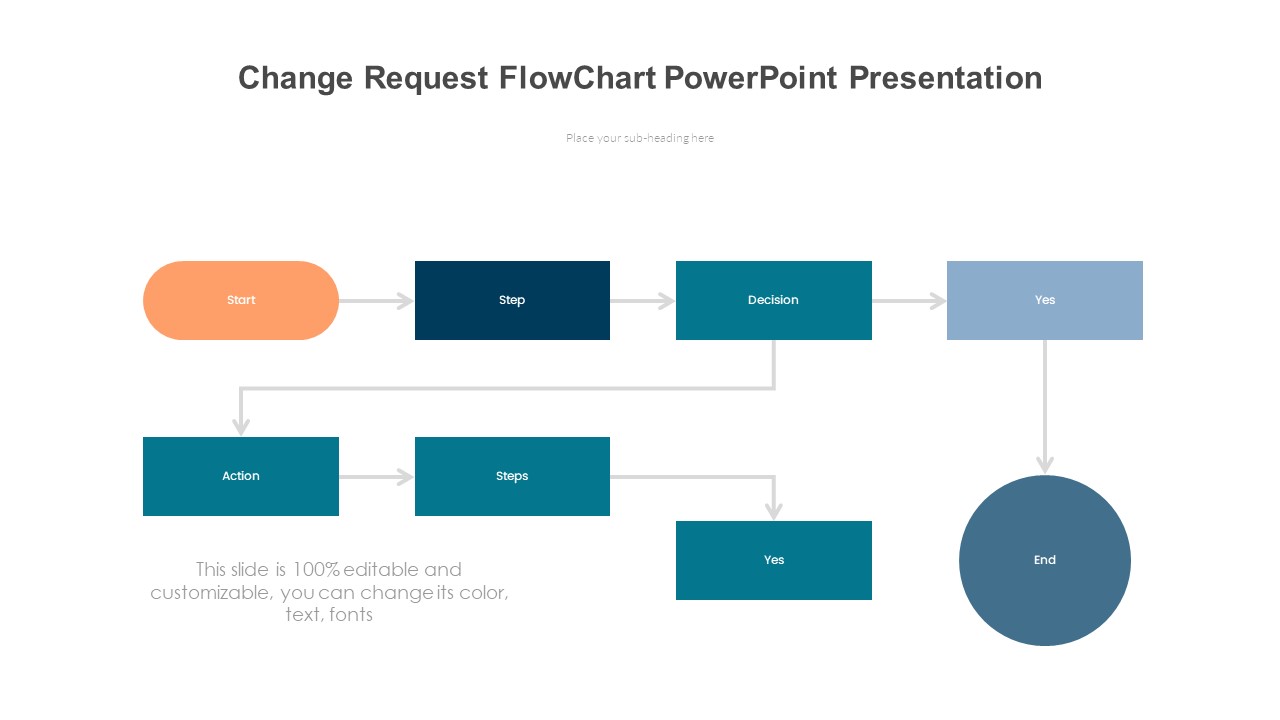
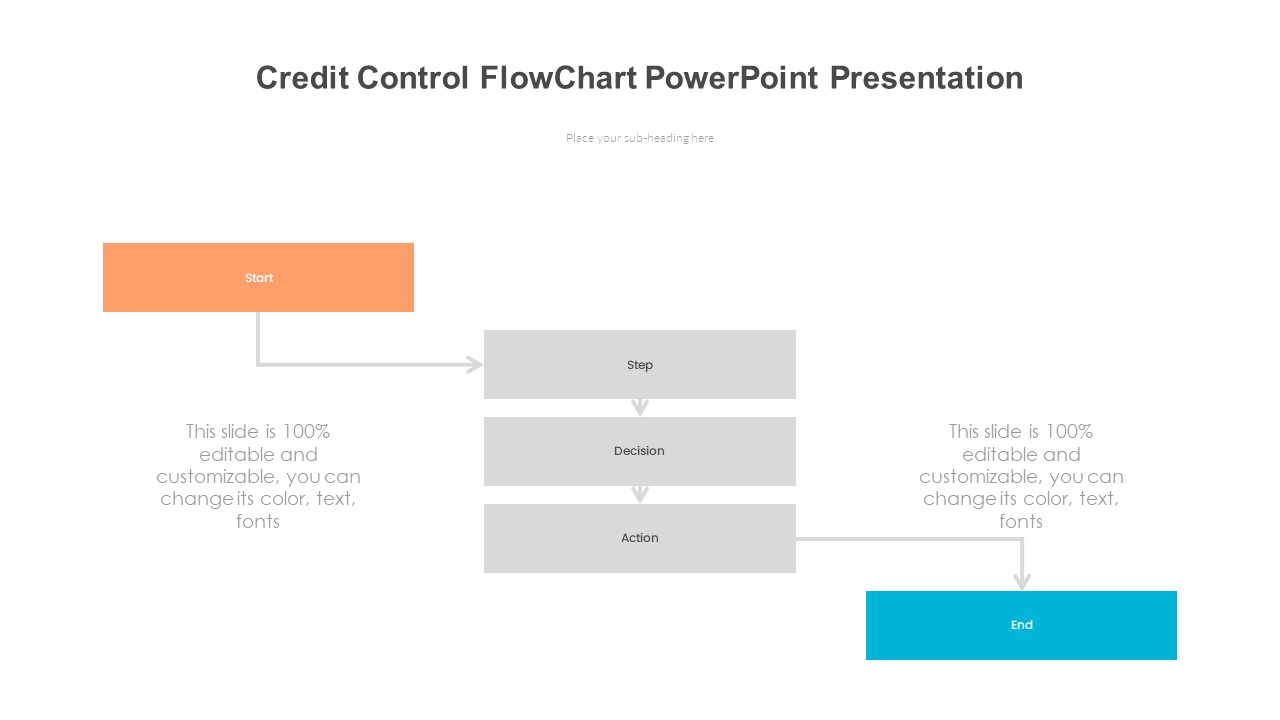
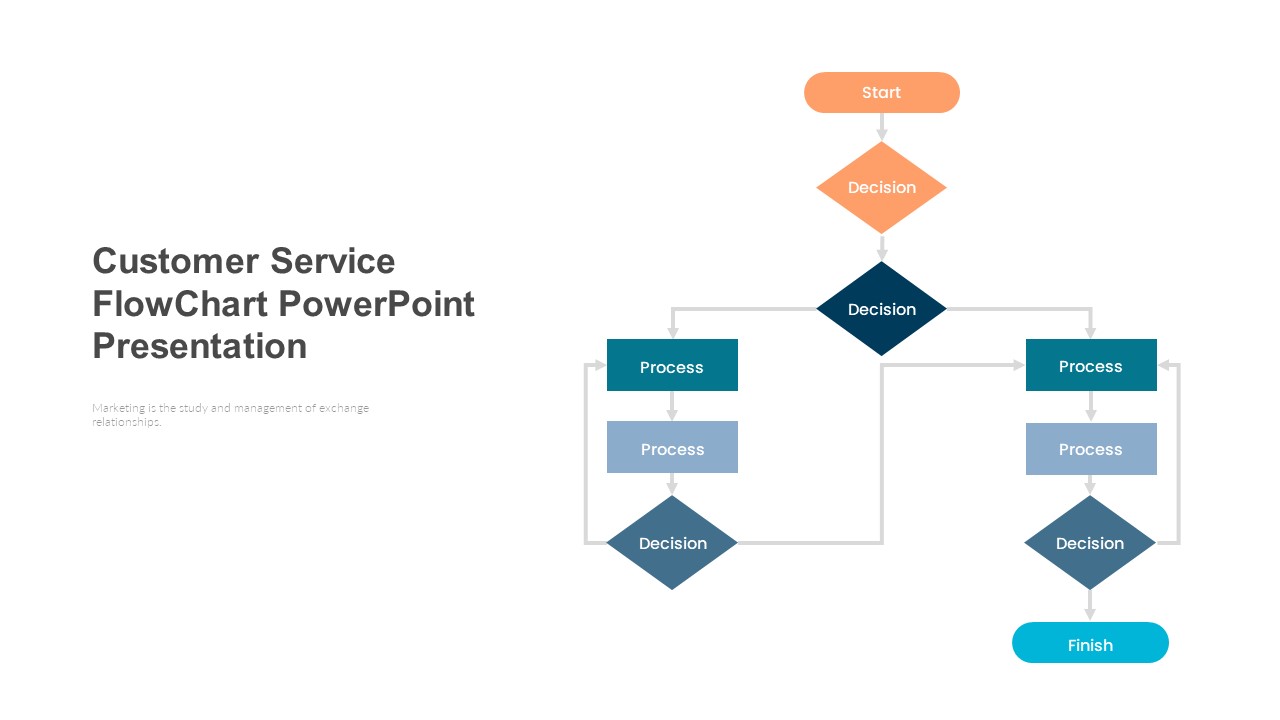
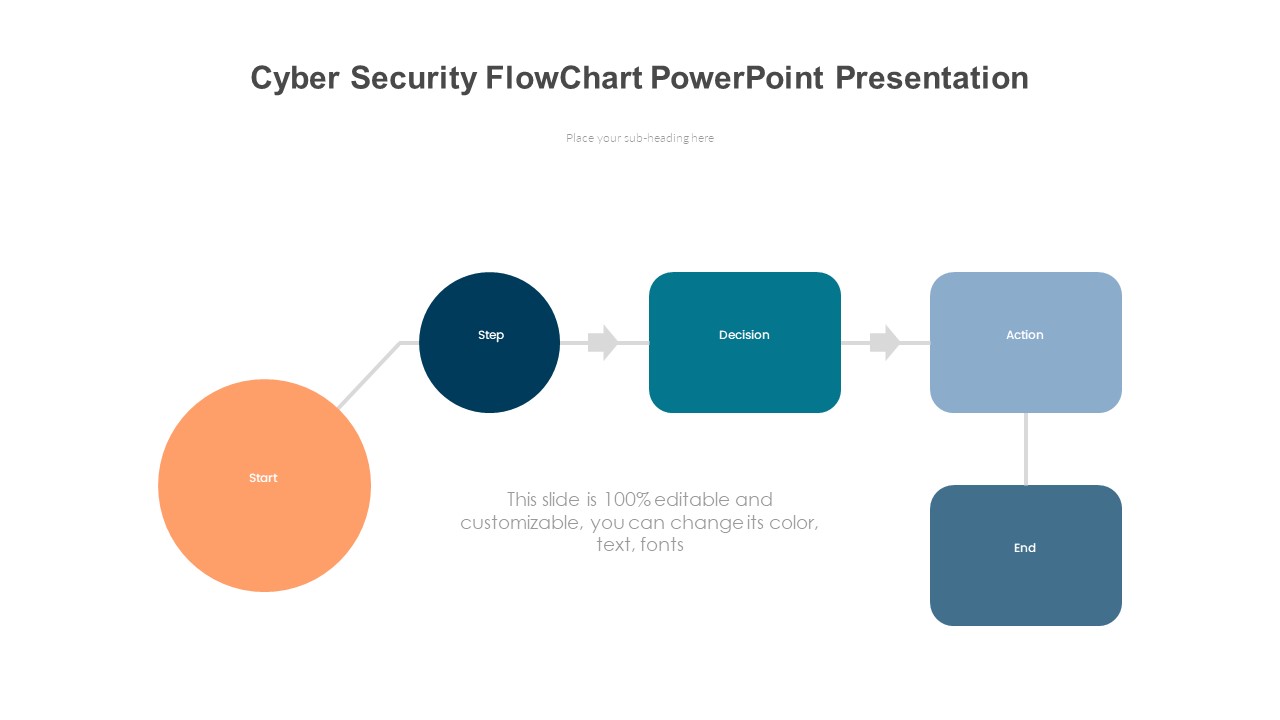
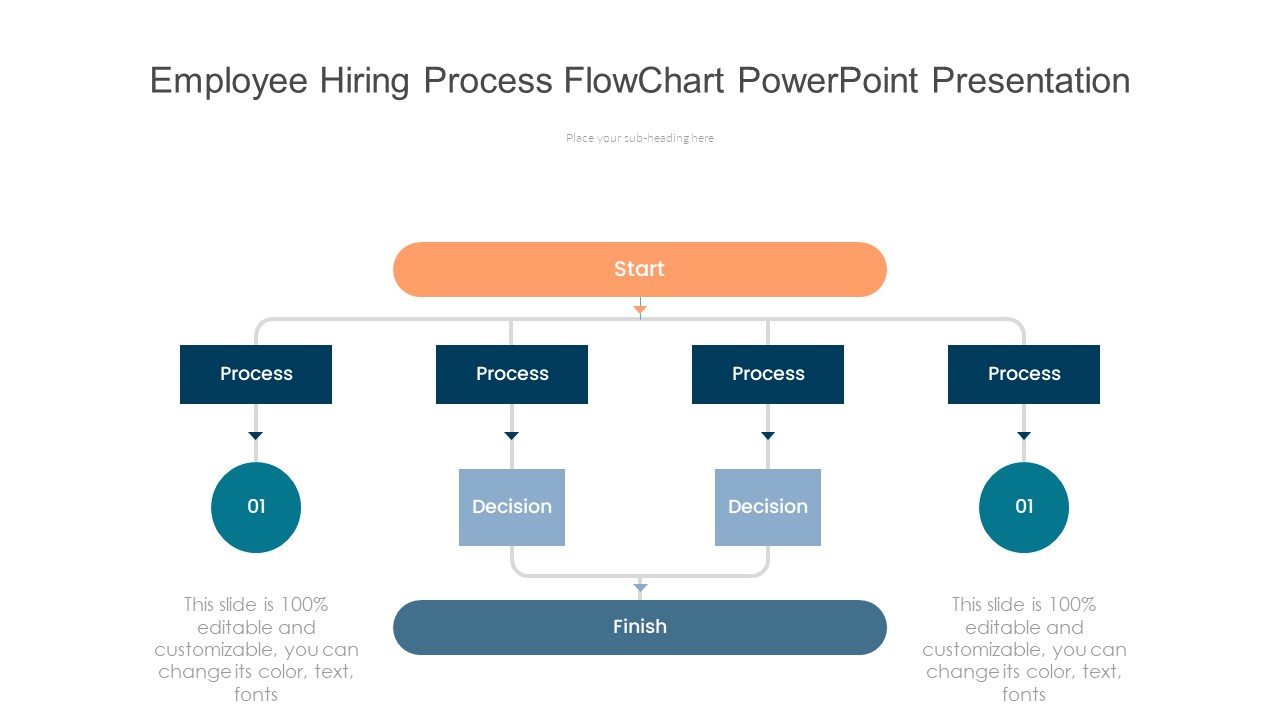
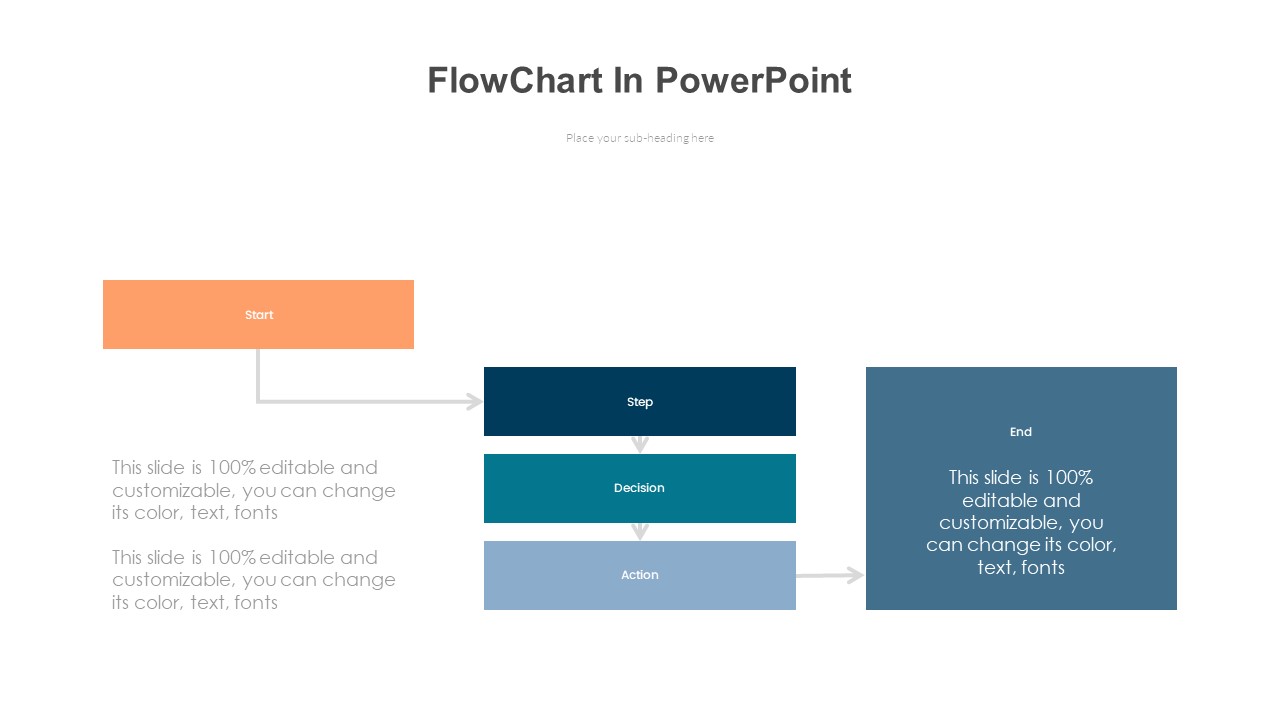
Flowchart PowerPoint presentations typically feature a series of interconnected shapes, symbols, and arrows representing the sequence of steps or actions within a process. They can range from simple linear workflows to intricate diagrams depicting multifaceted processes with branching pathways. Each element in the flowchart is strategically placed to depict the flow of information, materials, or activities from start to finish.
Businesses often utilize flowchart PowerPoint presentations for process optimization, workflow analysis, project management, and procedural documentation. They help teams identify inefficiencies, bottlenecks, and opportunities for improvement, leading to streamlined operations and increased productivity. Additionally, flowcharts aid in training new employees by providing visual guidance on how tasks are performed within an organization.
In academic and research settings, flowchart PowerPoint presentations are utilized to illustrate experimental methodologies, data analysis procedures, and theoretical frameworks. They serve as visual aids to clarify complex concepts, enhance comprehension, and facilitate knowledge transfer among students, researchers, and educators.
Overall, flowchart PowerPoint presentations are versatile tools that promote clarity, efficiency, and effective communication of processes and procedures across various domains, ultimately contributing to better decision-making and organizational performance.
Meta Description (120-140 characters):