

Description
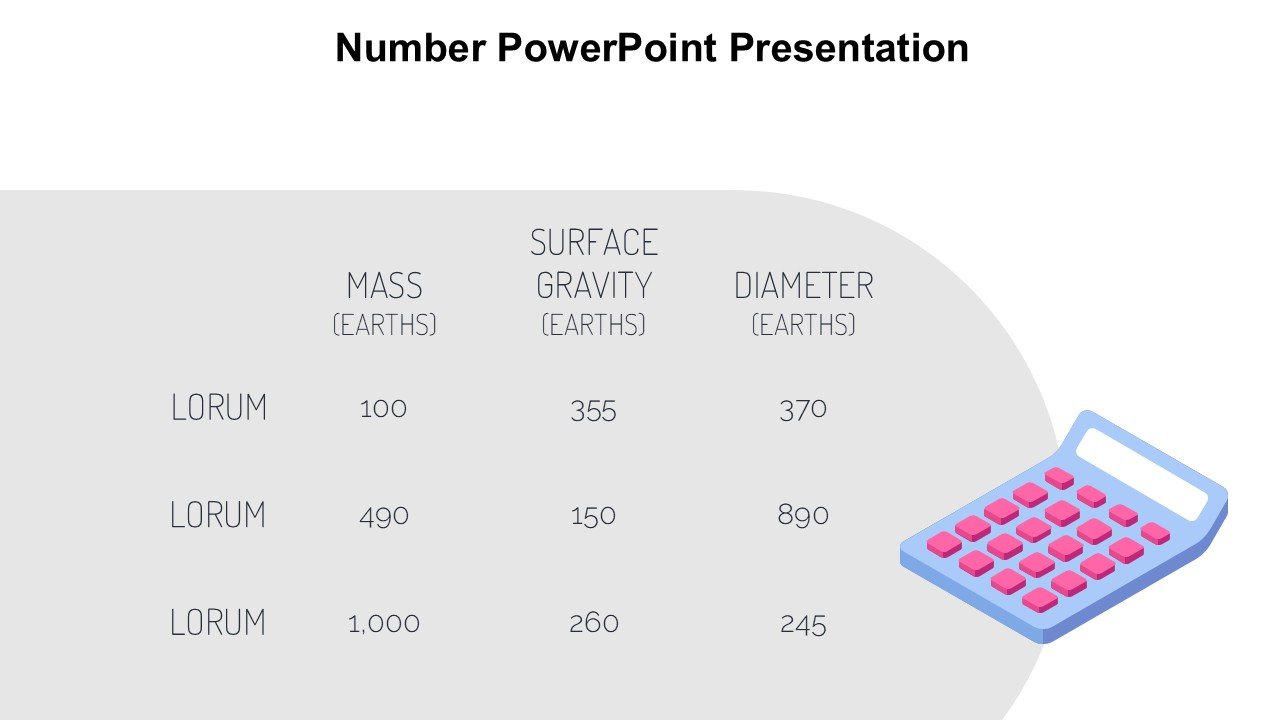
The Number PowerPoint Presentation PPT template is a meticulously designed slide template tailored to meet the needs of educators, business professionals, and data analysts who require a clear and effective way of presenting numerical data or statistics. This presentation template is ideal for anyone looking to convey complex numerical information in a visually appealing and easily digestible format.
Understanding numbers and their implications is crucial across various fields, from academic research to financial reporting and market analysis. The Number PowerPoint Presentation slide template serves as an invaluable resource by providing a structured way to showcase this data. Each slide is crafted to highlight key figures and statistics, ensuring that the audience can grasp detailed concepts and data at a glance.
For educators, this PPT template assists in teaching subjects that involve significant numerical data, allowing for clearer explanations and better student comprehension. In the corporate sphere, professionals can leverage this PPT slide to present quarterly results, financial forecasts, or any statistical report that aids in strategic planning and decision-making. Advocates and researchers can also use this template to present study findings or statistical evidence to support their causes or hypotheses.
The design of the Number PowerPoint Presentation PPT template is both professional and versatile, featuring a range of graph styles, charts, and data widgets. These elements are fully customizable to suit different preferences and presentation needs. The template’s intuitive design ensures that it is accessible to users with varying levels of PowerPoint proficiency, from beginners to advanced users.
Features:
– Fully editable templates: Customize every element of the slides with ease.
– Compatible with PowerPoint and Google Slides: Works across popular presentation platforms.
– High-quality visuals and graphics: Ensures professional-looking presentations.
– Diverse range of slide designs: Includes charts, graphs, and infographic styles.
– Easy-to-use layout: Ideal for users of all skill levels.
– Multiple color schemes: Choose from a variety of color palettes to match your branding or style.
Use Cases:
– Ideal for classroom teaching on subjects involving math, statistics, or economics.
– Suitable for corporate presentations such as financial reports, market analysis, or business forecasts.
– Perfect for academic presentations, especially in the fields of science and economics.
– Useful for non-profit organizations to present statistical evidence in advocacy or fundraising campaigns.
– Applicable for data analysts presenting complex data in a structured and understandable manner.

There are no reviews yet.