

Description
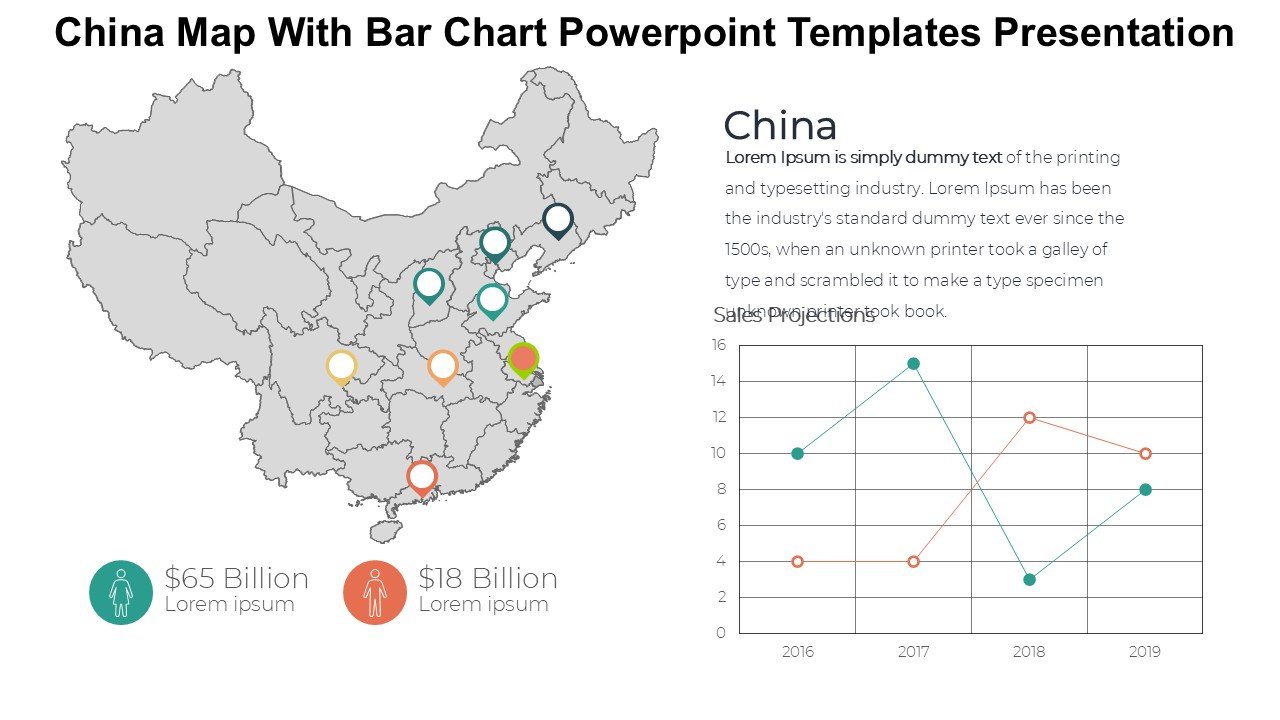
The China Map With Bar Chart PowerPoint Templates Presentation PPT template is an innovative presentation resource designed to provide educators, business professionals, and policy advocates with a powerful visual tool for displaying geographic and statistical data related to China. This PPT template integrates detailed maps of China with customizable bar charts, allowing users to effectively communicate complex data in a clear and engaging manner.
Crafted with precision, the China Map With Bar Chart PowerPoint Templates Presentation slide template is perfect for a variety of professional settings. Whether you are presenting economic data, demographic statistics, or environmental information, this PPT slide facilitates a deeper understanding of the data’s geographical distribution and implications. The template’s design is focused on clarity and ease of use, ensuring that even users with minimal graphic design experience can create compelling presentations.
This PPT template is especially useful for educators who need to illustrate the regional distribution of various phenomena in China, such as population density, economic growth, or resource allocation. For business professionals, the template serves as an excellent tool for market analysis presentations or regional sales reports that need a visual representation of data across different provinces in China. Additionally, policy advocates will find the China Map With Bar Chart PowerPoint Templates Presentation PPT template invaluable for highlighting regional disparities or showcasing the impact of policies at a provincial level.
The template’s functionality is enhanced by its compatibility with popular presentation platforms like Microsoft PowerPoint and Google Slides, making it accessible to a wide range of users. The seamless integration with these platforms ensures that your presentations are not only informative but also visually appealing and professional.
Features:
– Fully editable templates: Customize every element of the slides with ease.
– High-resolution maps: Detailed maps of China ensure precision in data presentation.
– Integrated bar charts: Easily adjustable bar charts to represent quantitative data.
– Compatible with PowerPoint and Google Slides: Works seamlessly across popular presentation platforms.
– Multi-purpose design: Suitable for educational, professional, and advocacy-related presentations.
– Supports animation and transitions: Enhance your presentation with dynamic effects.
– Diverse color schemes: Choose from various pre-designed color themes or create your own.
Use Cases:
– Ideal for educational presentations on geographical and statistical data of China.
– Suitable for business professionals presenting market analysis or regional sales data.
– Perfect for policy advocates discussing regional policies or impacts across China.
– Useful for economic forums or conferences focusing on Asian markets.
– Applicable in academic settings for research presentations on demographic or economic studies related to China.
– Valuable for government presentations on regional development or resource distribution.


There are no reviews yet.