

Description
Introducing the Visualizing Sales Targets: Charts, Graphs, and Dashboards PowerPoint Presentation, a comprehensive toolkit designed for professionals who aim to present their sales data in a clear, impactful, and visually appealing manner. This dynamic presentation package is tailored to meet the needs of sales managers, business analysts, marketing teams, and executives who require a detailed and understandable display of sales figures and forecasts.
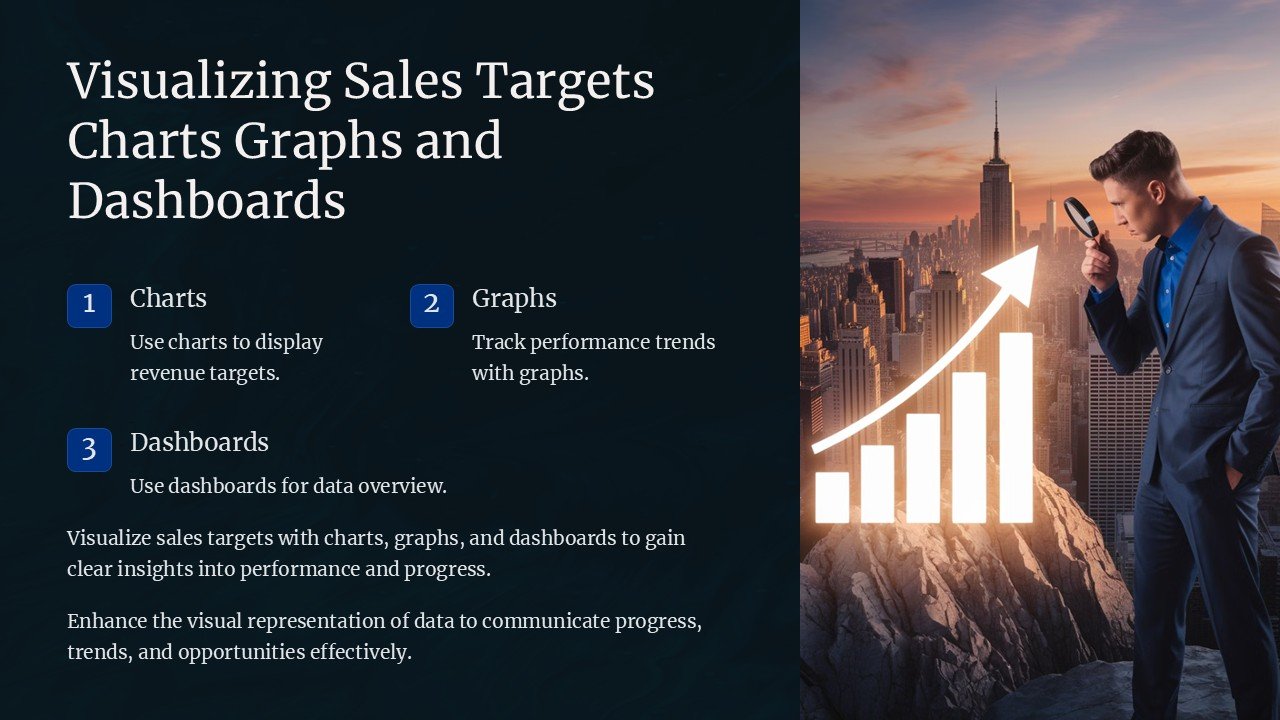
Our PowerPoint presentation comes packed with a variety of pre-designed slides that focus on charts, graphs, and dashboards specifically developed to represent sales data effectively. Each slide is crafted to highlight key sales metrics and targets, ensuring that your audience can quickly grasp trends, comparisons, and projections without getting lost in the details.
**Key Features of the Presentation:**
– **Diverse Range of Graphs and Charts:** From bar graphs and line charts to pie charts and area graphs, this presentation includes a wide array of visual tools. These are perfect for depicting everything from monthly sales trends and regional sales distributions to product line performances and individual team contributions.
– **Interactive Sales Dashboards:** The dashboards are designed with interactivity in mind, allowing presenters to navigate through different data points seamlessly. This feature is particularly useful for drilling down into specific data during live presentations or meetings.
– **Customizable Layouts:** Each slide template is fully editable. You can easily adjust the color schemes, text, and graphics to align with your company’s branding or presentation needs. This flexibility ensures that every presentation is both unique and personalized.
– **Clear, Concise Data Representation:** The templates are designed to present complex data in a straightforward manner. This helps in making informed decisions quickly and efficiently, a necessity in today’s fast-paced business environments.
– **Professional and Modern Design:** With a focus on contemporary design aesthetics, these slides are sleek, professional, and suitable for a corporate environment. The clean layout and coherent design language ensure that the focus remains firmly on the data presented.
– **Compatibility and Accessibility:** The product supports both PowerPoint and Google Slides, making it accessible to users regardless of their preferred presentation software. This versatility ensures that you can present your sales data on multiple platforms without compatibility issues.
The Visualizing Sales Targets: Charts, Graphs, and Dashboards PowerPoint Presentation is not just a tool, but a transformative means of communicating your sales objectives and achievements. Whether it’s a board meeting, a sales review, or a team briefing, these slides are designed to convey your message with clarity and precision, driving home the impact of your data through stunning visuals and user-friendly designs.
**Product Benefits:**
– **Enhanced Presentation Skills:** Improve how you present complex sales data with structured and easy-to-understand slides.
– **Save Time:** With ready-to-use templates, you spend less time designing and more time analyzing and interpreting your sales data.
– **Boost Engagement:** The visually engaging charts and graphs are designed to catch and hold the attention of your audience, making your presentations more effective.
Empower your sales presentations with the Visualizing Sales Targets: Charts, Graphs, and Dashboards PowerPoint Presentation. Elevate your data presentation game and make every sales report an opportunity to impress and inform with clarity and style.


There are no reviews yet.