

Description
Unlock the potential of your data with the Series Analysis PowerPoint Presentation slide template, expertly designed to cater to the needs of educators, professionals, and advocates in various fields. This comprehensive PPT template is crafted to assist you in presenting complex series analysis in a structured and understandable manner, making it an indispensable resource for anyone dealing with time series data, financial series, or any sequential dataset analysis.
The Series Analysis PowerPoint Presentation PPT template is developed with precision to ensure that your audience can grasp the trends, patterns, and insights from the data presented. Each slide is thoughtfully designed to facilitate the explanation of data series, forecast models, and result interpretation, making complex information accessible and engaging. Whether you are a teacher illustrating statistical concepts, a financial analyst discussing market trends, or a researcher presenting scientific data, this presentation template will enhance your ability to communicate intricate series analyses effectively.
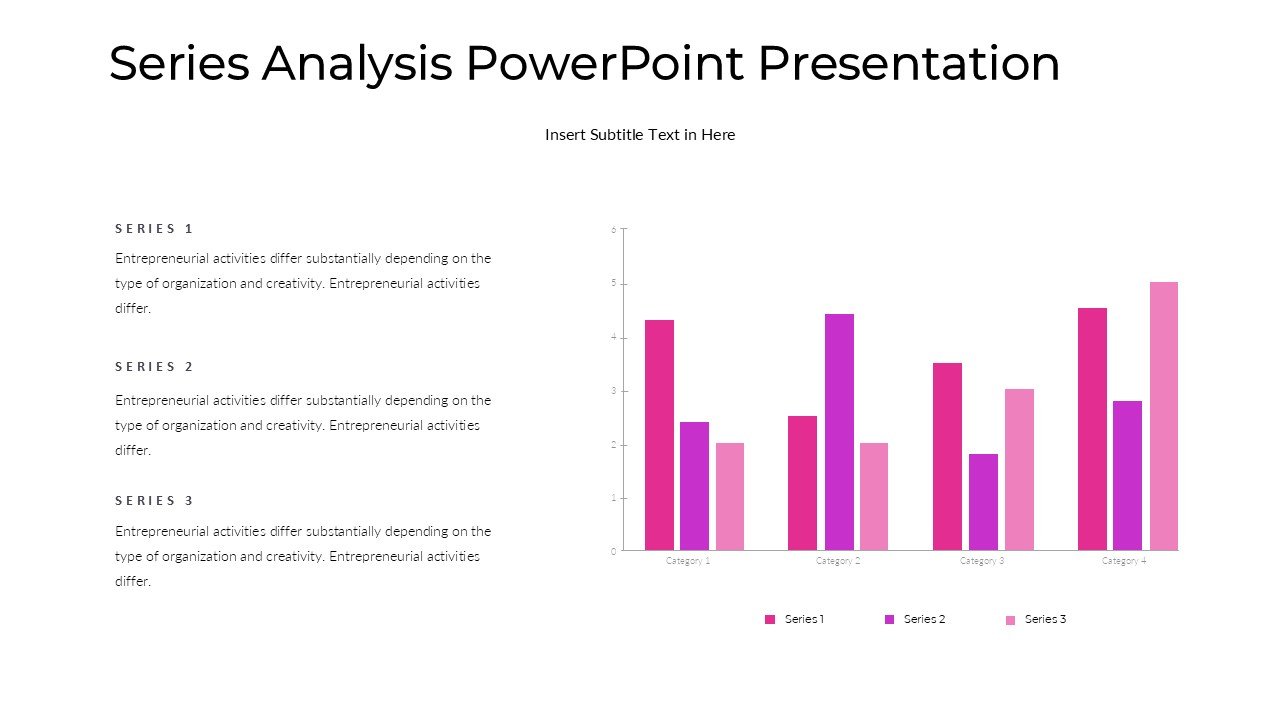
Our PPT slide template comes equipped with a variety of graphical representations, including line graphs, bar charts, and scatter plots, all of which are fully customizable to suit your specific data and presentation style. The layout and design elements of the PPT are crafted to maintain clarity while showcasing detailed data, ensuring that your audience remains engaged and informed throughout your presentation.
The Series Analysis PowerPoint Presentation PPT template is not just a visual aid but a comprehensive tool designed to enhance understanding and facilitate discussion. It is perfect for anyone looking to present data-driven insights in a professional, clear, and visually appealing manner.
Features:
– Fully editable templates: Customize every element of the slides with ease.
– High-quality graphics and charts: Ensure your presentations look professional and are easy to understand.
– Compatibility with PowerPoint and Google Slides: Works across popular presentation platforms.
– Wide variety of slide designs: Choose from different layouts to best present your specific data.
– User-friendly design: Easy to use even for those with minimal PowerPoint experience.
Use Cases:
– Ideal for academic teaching in economics, statistics, or business courses.
– Essential for financial analysts presenting market trends and forecasts.
– Suitable for scientific research presentations, especially in fields involving longitudinal data.
– Beneficial for professional workshops or seminars focusing on data analysis techniques.
– Useful for advocacy groups to present data trends and support their causes.

There are no reviews yet.