

Description
**Unlock the Power of Data with Our Performance Dashboard PowerPoint Presentation**
In the fast-paced corporate world, data is your most valuable asset when it comes to decision-making. Our Performance Dashboard PowerPoint Presentation is meticulously designed to help professionals across all industries visualize their performance metrics clearly and compellingly. Whether you’re a startup founder, a corporate executive, or a project manager, this tool is engineered to enhance your reporting process and bring clarity to complex data.
**Detailed and Dynamic Visualization**
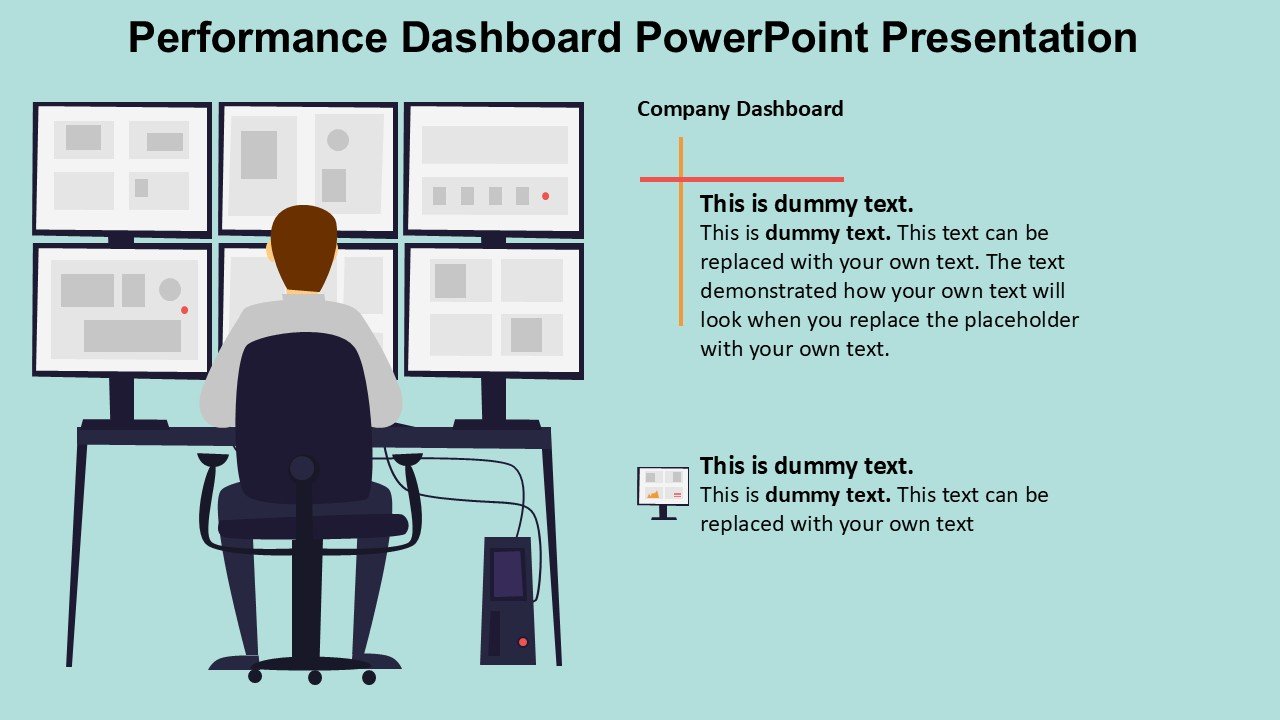
This PowerPoint presentation template is more than just a series of slides; it’s a comprehensive solution for displaying key performance indicators (KPIs) and other critical data points. Each slide is crafted with precision, incorporating a variety of charts, graphs, and gauges that make data not only accessible but also actionable. From sales figures and marketing analytics to financial forecasts and operational efficiencies, our dashboard covers all bases, ensuring you’re equipped to present data that is both informative and visually appealing.
**Customizable to Fit Every Need**
Understanding that every business has its unique set of metrics, we have designed this dashboard to be fully customizable. With just a few clicks, you can adjust colors, change text, switch out icons, and modify charts to reflect your specific data points and branding requirements. This level of personalization ensures that your presentation is always relevant and aligned with your organizational goals.
**Seamless Integration and Compatibility**
Our Performance Dashboard is built to be compatible with both PowerPoint and Google Slides, offering seamless integration with your existing tools. This compatibility ensures that you can start utilizing the dashboard without any technical hitches, regardless of your preferred presentation software. The ease of use and flexibility provided by this compatibility means that your data can be updated and presented anytime, anywhere, without needing specialized software or training.
**Features:**
– **Fully Editable Templates**: Every element of the Performance Dashboard PowerPoint Presentation is editable. You can easily customize fonts, colors, and backgrounds to match your corporate identity and personal preference. This feature allows for full control over the look and feel of your presentations, making them as unique as your data.
– **Support for PowerPoint and Google Slides**: Whether you are a long-time user of PowerPoint or prefer the accessibility of Google Slides, this dashboard has you covered. The templates are designed to work flawlessly across both platforms, providing you with flexibility and ease of use.
– **Diverse Range of Data Visualization Tools**: The template includes various types of charts, graphs, and tables, such as bar graphs, line charts, pie charts, and more. These tools are crucial for breaking down complex data into understandable and visually engaging formats.
– **Real-time Data Implementation**: Easily update your presentations with real-time data to keep your information relevant. This feature is essential for making timely decisions based on the latest data trends.
– **User-friendly Design**: The dashboard is designed keeping in mind the end-user. The layout is intuitive, making it easy for anyone in your organization to adapt and use without extensive training.
In conclusion, our Performance Dashboard PowerPoint Presentation is more than just a tool; it’s an essential asset that empowers you to present your performance data with confidence and clarity. It’s designed for leaders who demand precision and flexibility in their reporting tools. Elevate your presentations and make data-driven decisions with an unmatched level of professionalism and efficiency.
There are no reviews yet.