

Description
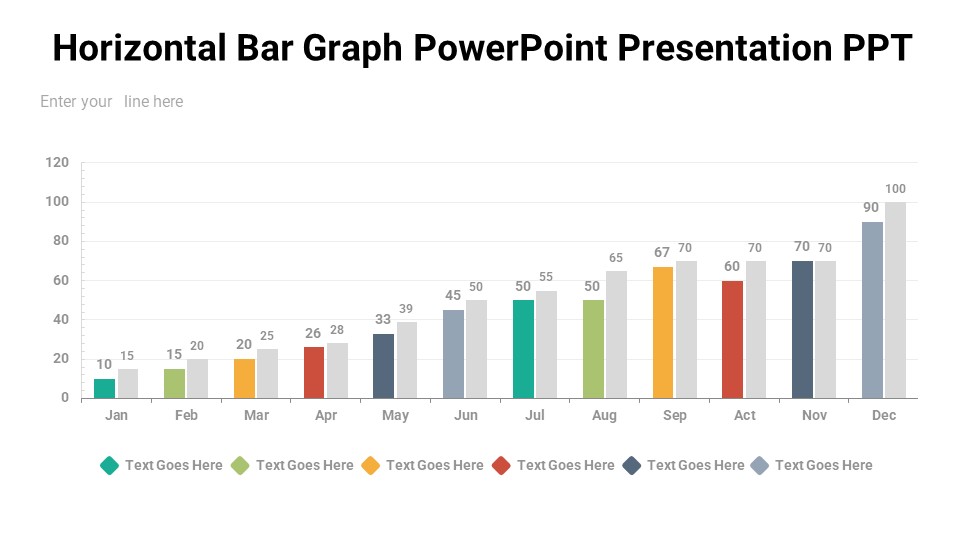
The Horizontal Bar Graph PowerPoint Presentation PPT is the perfect tool for visually representing data and analytics in a clear and professional manner. This comprehensive presentation template includes a variety of horizontal bar graph designs that can be easily customized to suit your specific needs.
With the Horizontal Bar Graph PowerPoint Presentation PPT, you can quickly and easily create eye-catching presentations that will impress your audience. Whether you are showcasing sales figures, market research data, or any other type of numerical information, this template has everything you need to create stunning bar graphs that effectively convey your message.
Key Features:
1. Fully Editable Templates: All the bar graph templates included in this presentation are fully editable, allowing you to customize them with your data and branding elements.
2. Easy Customization: With a few simple clicks, you can change the color scheme, font styles, and layout of the bar graphs to match your presentation theme.
3. Data Visualization: The horizontal bar graphs are designed to effectively visualize data and make it easier for your audience to understand and interpret the information.
4. Professional Design: The templates feature a sleek and modern design that will give your presentation a polished and professional look.
5. Versatile Usage: Whether you are creating a business report, a project presentation, or a financial analysis, the Horizontal Bar Graph PowerPoint Presentation PPT is suitable for a wide range of applications.
Overall, the Horizontal Bar Graph PowerPoint Presentation PPT is a valuable resource for anyone looking to create impactful presentations that effectively communicate data and analytics. Its fully editable templates make it easy to customize and use, making it a must-have tool for professionals who regularly work with numerical information.

There are no reviews yet.