

Description
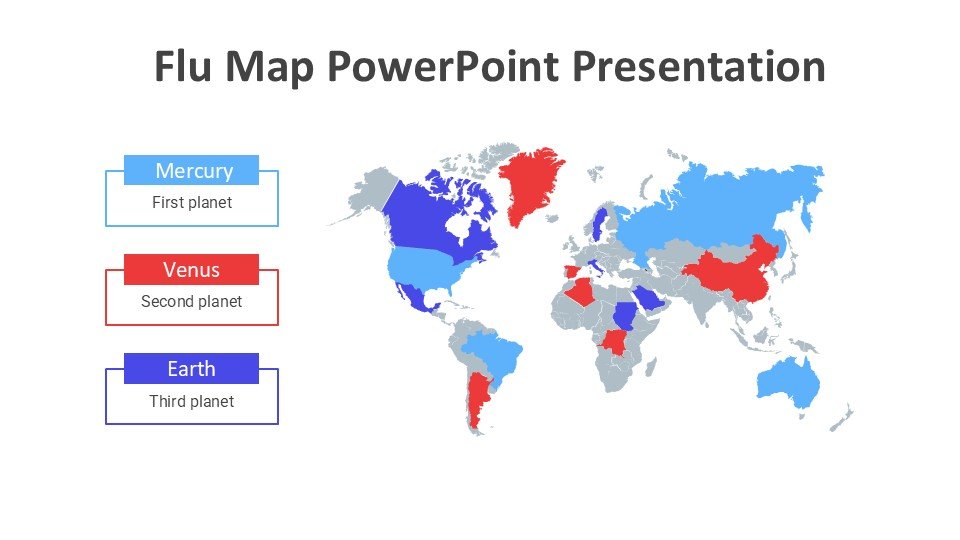
The Flu Map PowerPoint Presentation PPT template is an essential resource designed to facilitate the understanding and dissemination of information related to influenza tracking and prevention. This comprehensive PPT slide set is tailored specifically for health educators, medical professionals, public health advocates, and anyone involved in the study or management of flu outbreaks. The presentation template includes a series of meticulously crafted slides that combine visual appeal with functional design to communicate critical data about flu trends, vaccination coverage, and outbreak management strategies effectively.
Each slide in the Flu Map PowerPoint Presentation slide template is structured to support the presentation of data in a clear and engaging manner. The template features maps, charts, and infographics that are all customizable, allowing users to adapt the presentation to reflect specific data and regional focus areas. This versatility makes the PPT template an invaluable asset for delivering targeted information to diverse audiences, ranging from medical staff and health policymakers to the general public.
The slide templates are designed not only for their visual quality but also for ease of use. Users can quickly insert their data, modify layouts, and adjust designs without needing extensive technical skills. This makes the Flu Map PowerPoint Presentation PPT template a go-to choice for professionals who need to create impactful and informative presentations with a professional look, without dedicating excessive time to design processes.
Whether it’s for a conference, a classroom, or a community health meeting, the Flu Map PowerPoint Presentation slide template ensures that your message is conveyed with clarity and professional rigor. It’s an indispensable presentation template for anyone committed to educating and informing about the flu in a factual and persuasive manner.
Features:
– Fully editable templates: Customize every element of the slides with ease.
– High-quality visuals: Maps, charts, and infographics enhance the presentation of complex data.
– Professional and clean design: Ensures your presentation looks polished and authoritative.
– Easy to use: Simple for beginners and professionals alike to add their data and modify content.
– Versatile application: Suitable for various educational, professional, and advocacy settings.
– Wide compatibility: Works seamlessly with Microsoft PowerPoint.
Use Cases:
– Used by health educators for teaching students and trainees about influenza trends and prevention.
– Employed by medical professionals for presenting at health conferences or seminars.
– Utilized by public health officials for community outreach and educational campaigns.
– Adapted by researchers to share findings and updates in academic and professional settings.
– Beneficial for NGO workers in creating informative materials for public health awareness.
There are no reviews yet.