

Description
Make your financial presentations more impactful with the Financial Graphs PowerPoint Presentation PPT template. This comprehensive slide template is designed specifically for finance professionals, educators, and advocates who need to communicate complex financial data effectively. Whether you’re presenting quarterly results, forecasting budgets, or teaching financial concepts, this PPT template is equipped to help you deliver your message clearly and persuasively.
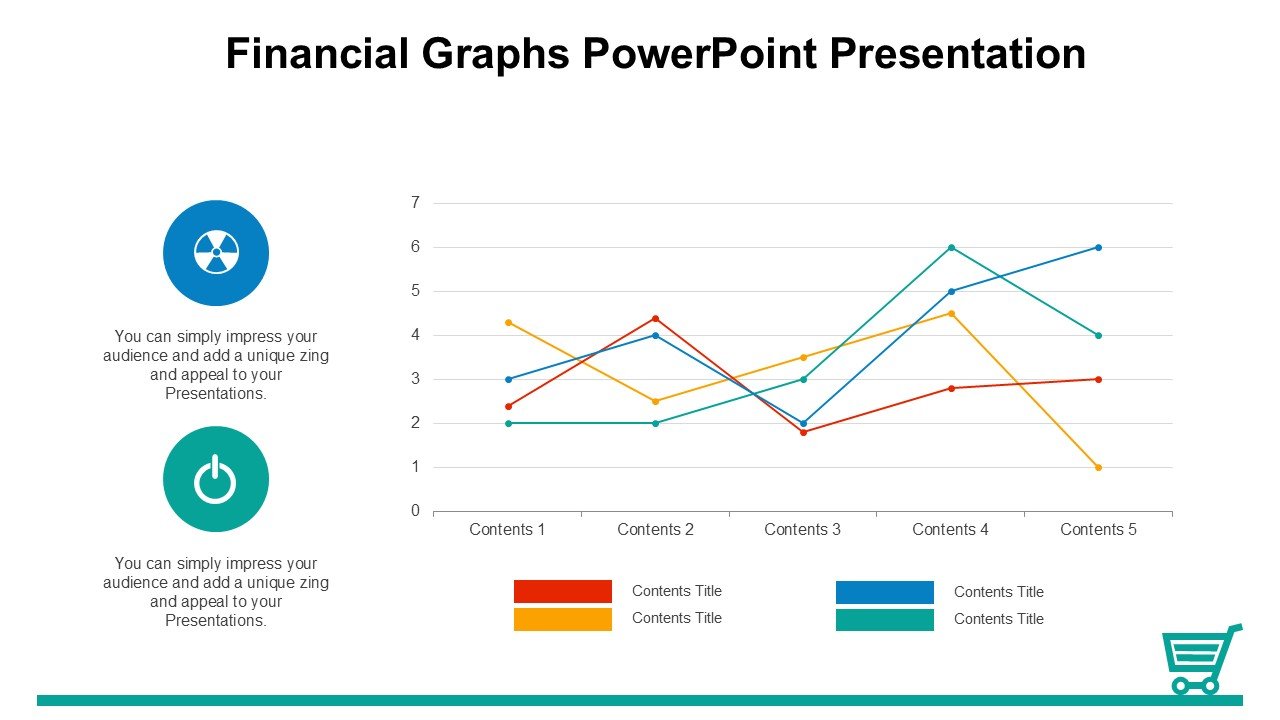
The Financial Graphs PowerPoint Presentation slide template includes a variety of graph types, such as bar graphs, pie charts, line graphs, and scatter plots, each tailored to showcase financial statistics in the most comprehensible way. These pre-designed slides are not only aesthetically pleasing but are crafted to facilitate the understanding of financial trends, comparisons, and forecasts. With this presentation template, you can transform raw data into visually engaging stories that capture and retain your audience’s attention.
This PPT template is perfect for business analysts, financial consultants, economics teachers, and anyone in need of presenting monetary information in a structured and appealing format. The design is sleek and professional, ensuring that the focus remains on the data presented. Each slide in the Financial Graphs PowerPoint Presentation PPT template is fully customizable, allowing you to adjust colors, text, and shapes to fit your branding or personal preference without losing the polished look of your presentation.
Utilize the Financial Graphs PowerPoint Presentation slide template to enhance your next financial report or academic lecture. It’s not just about showing numbers; it’s about making them understandable and impactful.
Features:
– Fully editable templates: Customize every element of the slides with ease.
– High-quality visuals: Professional designs ensure your presentations look sharp.
– Diverse graph options: Includes a variety of graph types to suit different data sets.
– Easy to use: Simple drag-and-drop placeholders for quick customization.
– Wide compatibility: Works seamlessly with PowerPoint and other popular presentation software.
Use Cases:
– Perfect for corporate financial presentations: Deliver compelling earnings reports and financial statements.
– Ideal for educational purposes: Teach students about financial principles using clear visuals.
– Useful for economic research presentations: Present complex data analyses at conferences or seminars.
– Essential for financial planning meetings: Use graphs to discuss budgets, forecasts, and financial strategies.


There are no reviews yet.