

Description
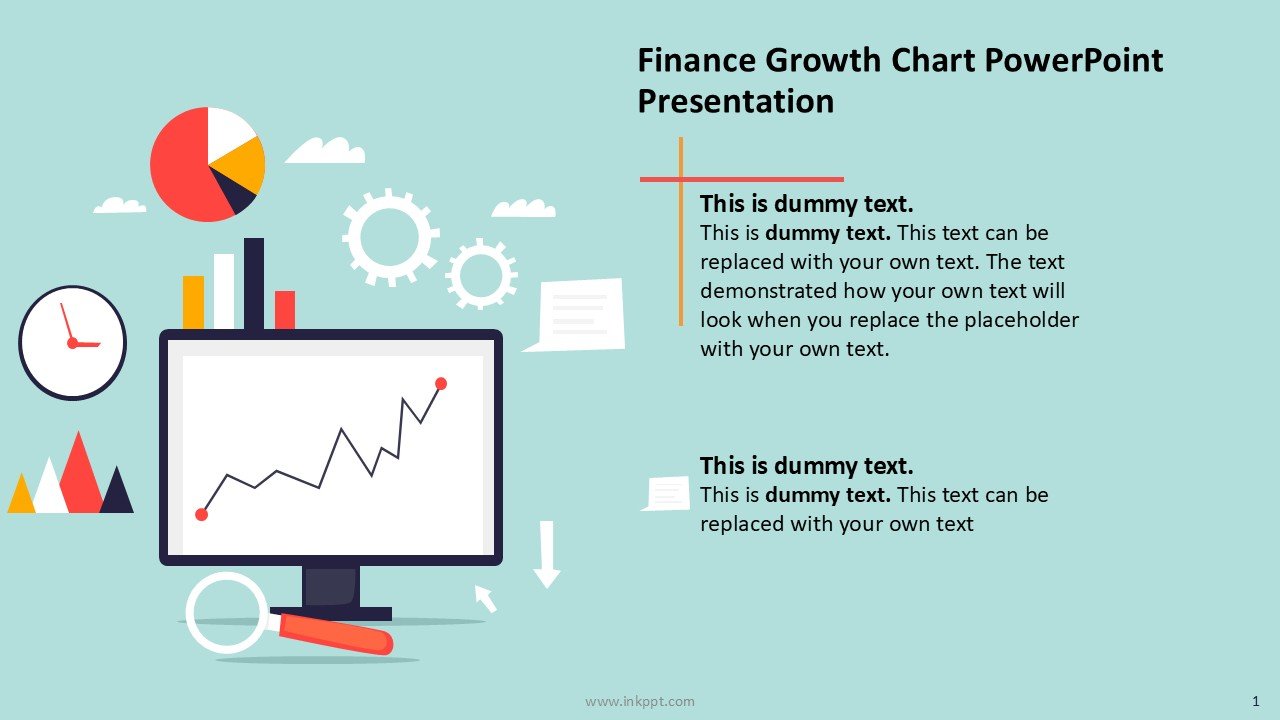
Introducing the Finance Growth Chart PowerPoint Presentation, an essential tool designed for financial analysts, business strategists, and corporate planners who aim to showcase financial growth and progress effectively. This comprehensive PowerPoint presentation template is tailored to help professionals present complex financial data in a visually appealing and easy-to-understand manner.
Crafted with precision, the Finance Growth Chart PowerPoint Presentation includes a variety of slide designs, each focusing on different aspects of financial growth such as revenue analysis, profit margins, investment returns, and market trends. Each slide is meticulously designed to highlight key data points and trends, ensuring that your audience can easily grasp the financial story being told.
The template features a clean, professional layout with high-quality graphics and customizable elements. The color palette is chosen specifically to convey a sense of growth and positivity, using shades that are both eye-catching and professional. The use of clear, concise charts and graphs alongside detailed textual explanations makes this template a powerhouse for delivering impactful financial presentations.
One of the standout features of the Finance Growth Chart PowerPoint Presentation is its complete customizability. Whether you need to tweak the color scheme to match your company branding or adjust the data displays to suit specific case studies, this template allows for seamless modifications. Each slide is fully editable, giving you the freedom to choose how to present your data in ways that best suit your needs and preferences.
**Features of the Finance Growth Chart PowerPoint Presentation:**
1. **Fully Editable Templates:** Every element, from text boxes and fonts to color schemes and graphic details, can be customized to fit your unique presentation needs. This feature ensures that your financial presentations look distinct and professional.
2. **Compatibility with PowerPoint and Google Slides:** Designed to be versatile, the template supports both Microsoft PowerPoint and Google Slides. This cross-platform compatibility ensures that you can create, edit, and present using your preferred software environment without any compatibility issues.
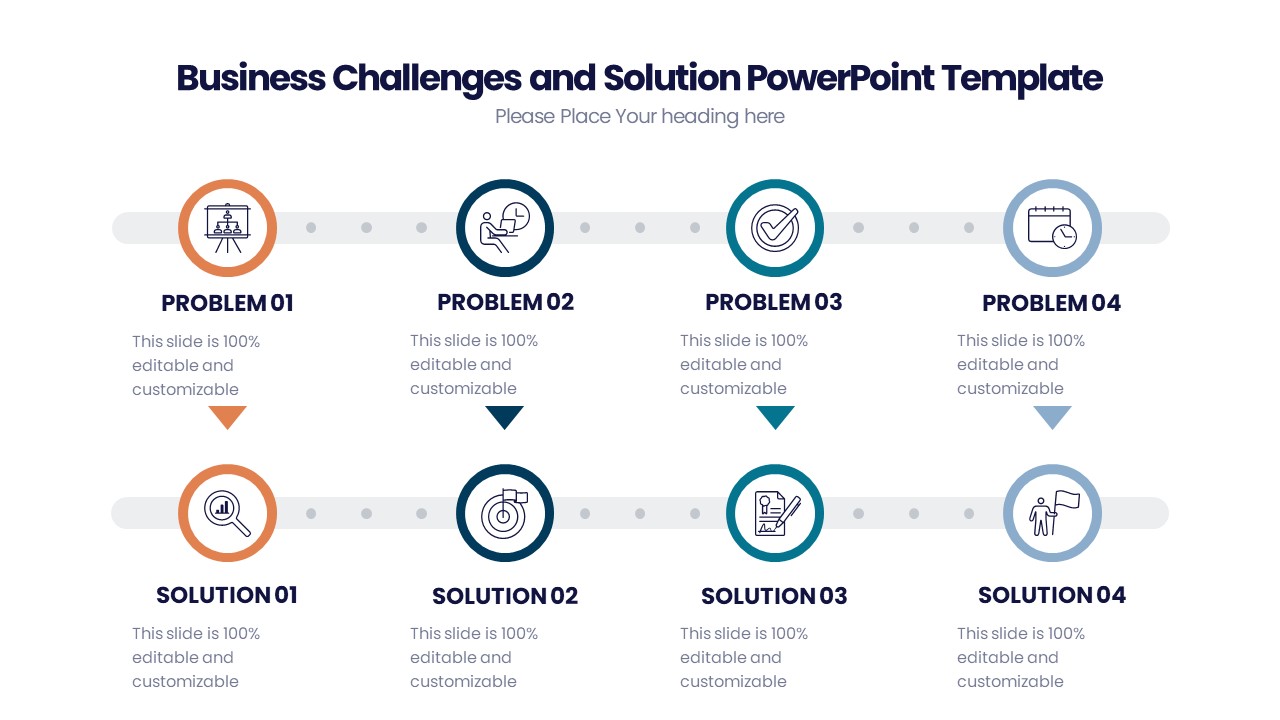
3. **Diverse Data Visualization Tools:** The template includes a variety of data visualization formats such as bar graphs, line charts, pie charts, and tables. Each format can be adapted to represent different data types and insights, making your presentation both comprehensive and engaging.
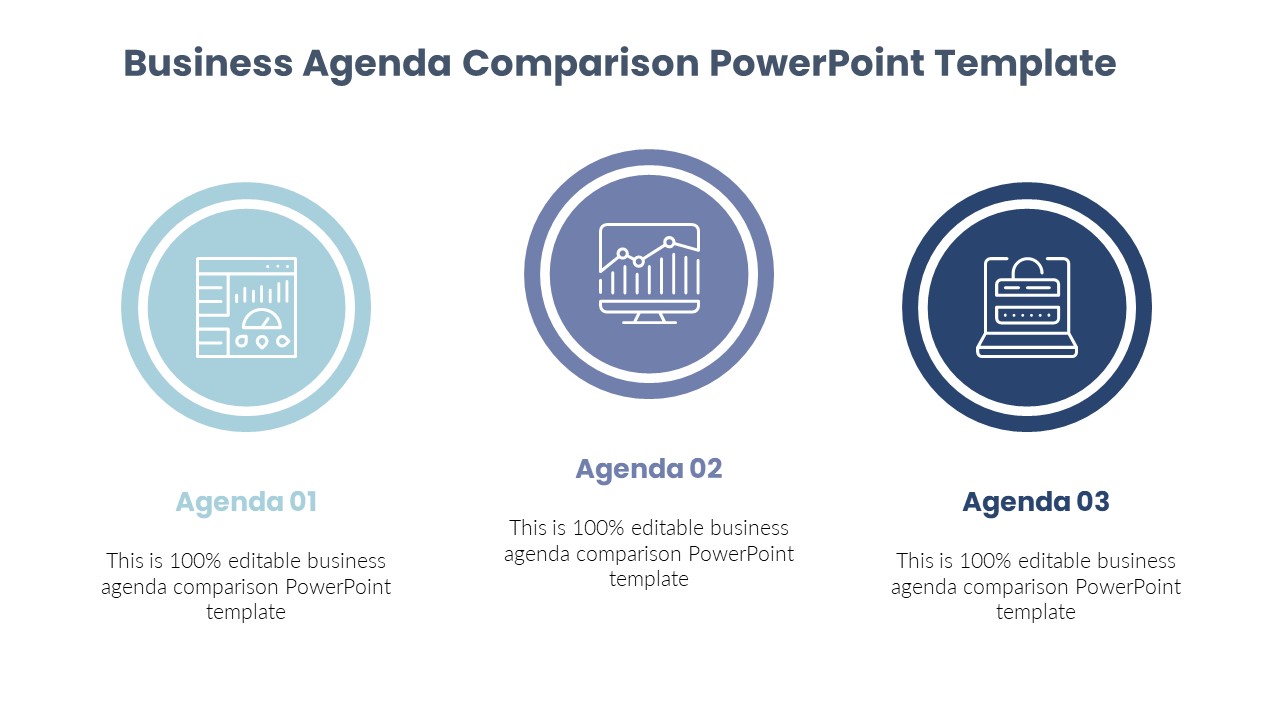
4. **Professional Design:** With a focus on financial growth, the design elements are crafted to be sharp, clear, and professional. This includes a thoughtful layout that directs the viewer’s attention to the most important data, supported by strategic use of colors and shapes that enhance visual hierarchy.
5. **Ease of Use:** Despite its sophisticated array of options and high level of customizability, the Finance Growth Chart PowerPoint Presentation is incredibly user-friendly. It comes with detailed instructions and tips for editing and personalizing your slides, making it accessible even to those with minimal experience in PowerPoint design.
6. **Scalability:** The template is designed to cater to both small businesses and large corporations, making it a versatile choice for presentations at all levels of corporate finance—from routine team meetings to high-stakes investor pitches.
Whether you’re preparing for an upcoming quarterly review, an annual report, or a pitch to potential investors, the Finance Growth Chart PowerPoint Presentation provides you with a powerful tool to convey your financial data with clarity and impact. Elevate your financial presentations and communicate your success stories with confidence and professionalism.


There are no reviews yet.