

Description
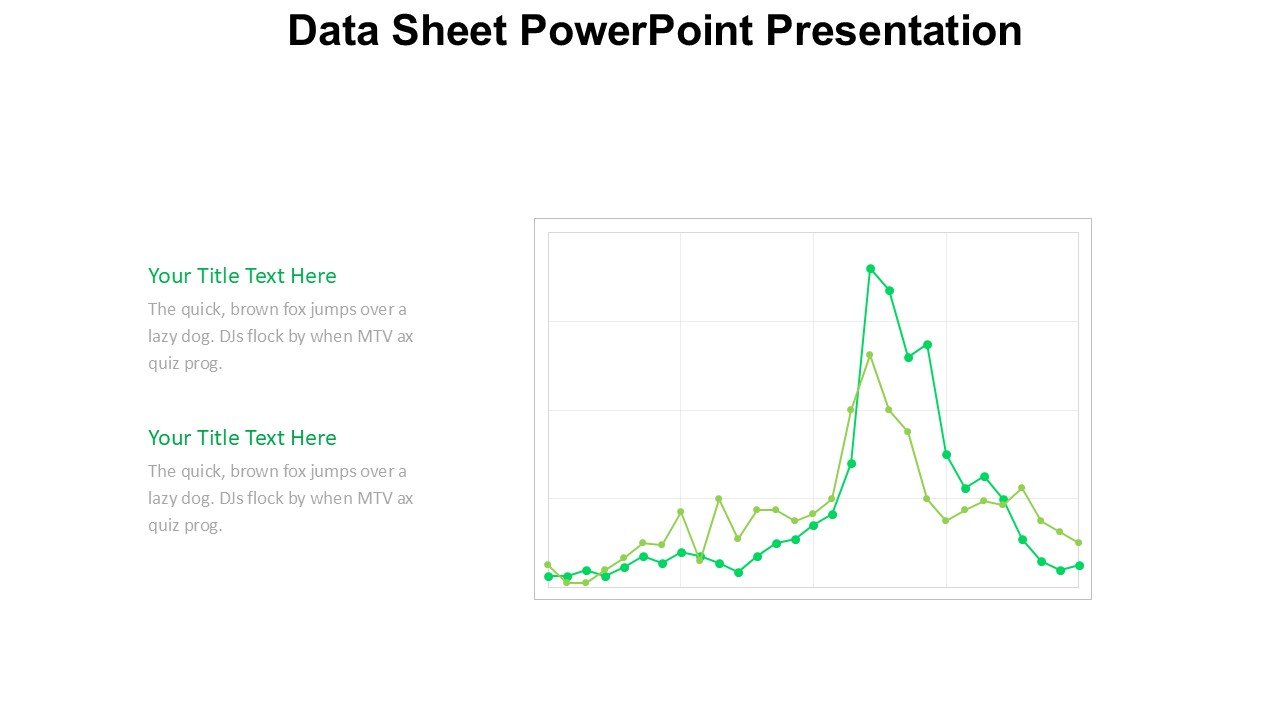
The Data Sheet PowerPoint Presentation PPT template is an essential resource designed to streamline the process of data presentation for professionals, educators, and advocates across a variety of fields. This comprehensive presentation template provides an organized framework for displaying and analyzing data in a clear, visually engaging manner. Whether you are a business analyst, a research scientist, or an educational professional, the Data Sheet PowerPoint Presentation slide template is tailored to help you convey complex information in an easily digestible format.
With its clean design and structured layout, this PPT template serves as an excellent backdrop to highlight key data points, trends, and analytics. The template includes several slide designs that cater to different types of data representation such as charts, tables, and graphs, ensuring that all forms of data can be presented effectively. Each slide is crafted to not only present data but to tell a story with that data, making it more impactful for the audience.
This presentation template is particularly useful for professionals who need to present data-driven insights in corporate meetings, academic conferences, or advocacy campaigns. It allows presenters to customize each slide to fit their specific needs while maintaining a professional look that aligns with organizational or personal branding. The Data Sheet PowerPoint Presentation PPT slide is also an excellent tool for educators who require a reliable method to present data to students in a manner that is both informative and engaging.
Overall, the Data Sheet PowerPoint Presentation slide template stands out as a versatile and indispensable resource for anyone who regularly works with data and needs an effective way to present it. Its adaptability and ease of use make it suitable for a wide range of applications, from business analytics to academic research presentations.
Features:
– Fully editable templates: Customize every element of the slides with ease.
– High-quality visuals: Includes charts, graphs, and tables designed to enhance data presentation.
– Professional design: Sleek and clean layout that suits various professional settings.
– Versatile slide formats: Cater to different types of data and presentation styles.
– Easy to use: User-friendly for professionals at any skill level.
– Compatibility: Works smoothly with Microsoft PowerPoint and other popular presentation platforms.
Use Cases:
– Ideal for corporate financial presentations to showcase quarterly results.
– Suitable for academic settings, such as presenting research findings or statistical information.
– Effective for non-profit organizations to present data on fundraising campaigns or community impacts.
– Useful for government agencies to report on public data or policy impacts.
– Beneficial for healthcare professionals presenting medical research or patient data statistics.
There are no reviews yet.