

Description
**Product Description:**
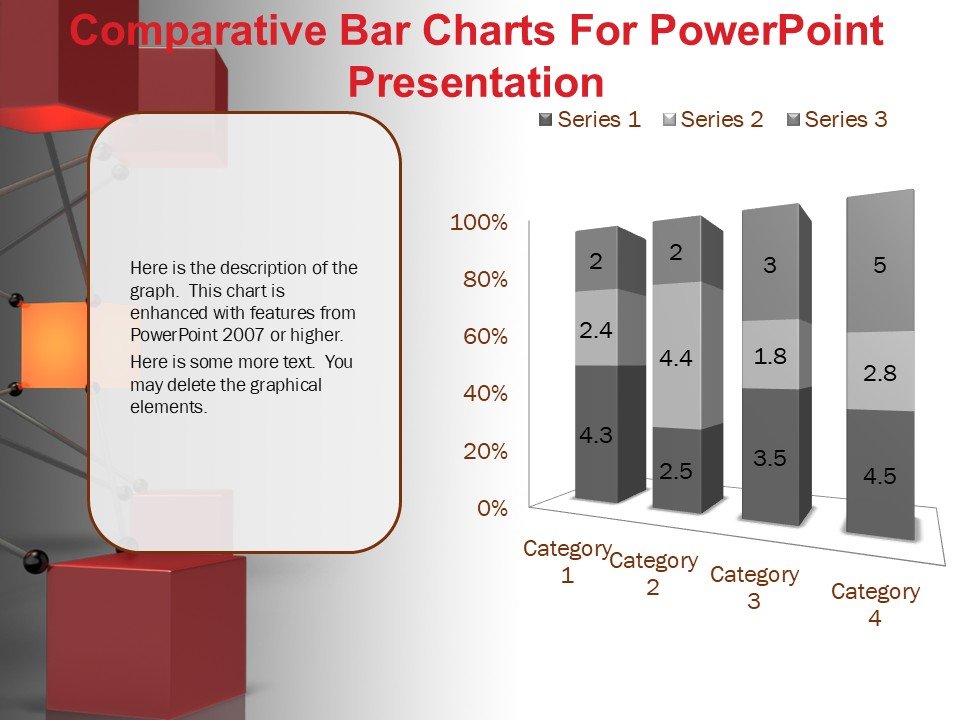
In the fast-paced world of information delivery, clarity and precision are paramount. The Comparative Bar Charts For PowerPoint Presentation PPT template is meticulously designed to meet the needs of educators, professionals, and advocates who require a robust, intuitive presentation template for showcasing comparative analyses. This PPT slide template serves as a crucial aid in communicating complex data in a straightforward, accessible manner.
The Comparative Bar Charts For PowerPoint Presentation slide template includes a variety of pre-designed slides that allow users to effortlessly compare different datasets side by side. Whether you are a teacher illustrating variances in statistical data to students, a business professional comparing quarterly sales figures, or an advocate highlighting the impact of policy changes over time, this PPT template is equipped to handle your specific needs.
Each slide in the Comparative Bar Charts For PowerPoint Presentation PPT template is crafted with attention to detail and is fully customizable to align with your presentation’s branding and stylistic preferences. The use of comparative bar charts not only enhances the visual appeal of your presentation but also aids in the audience’s understanding of the data, fostering a more engaging and productive discussion.
This presentation template is not just a collection of slides but a versatile tool that adapts to a wide range of subjects and industries. With its clean, professional design, it facilitates the effective communication of data-driven insights and comparisons in a visually appealing format that is easy to interpret.
**Features:**
– Fully editable templates: Customize every element of the slides with ease.
– High-quality visuals: Ensures clarity and visual appeal in presentations.
– Versatile slide designs: Suitable for a wide range of comparative analyses.
– Easy to use: Intuitive design for professionals of all skill levels.
– Compatibility with PowerPoint: Seamlessly works with Microsoft PowerPoint.
**Use Cases:**
– Ideal for educators teaching complex statistical concepts.
– Perfect for business professionals comparing financial performance across different periods.
– Suitable for policy advocates presenting changes and effects over time.
– Helpful for market researchers analyzing competitor data.
– Useful for healthcare professionals comparing patient outcomes or treatment efficacies.


There are no reviews yet.