

Description
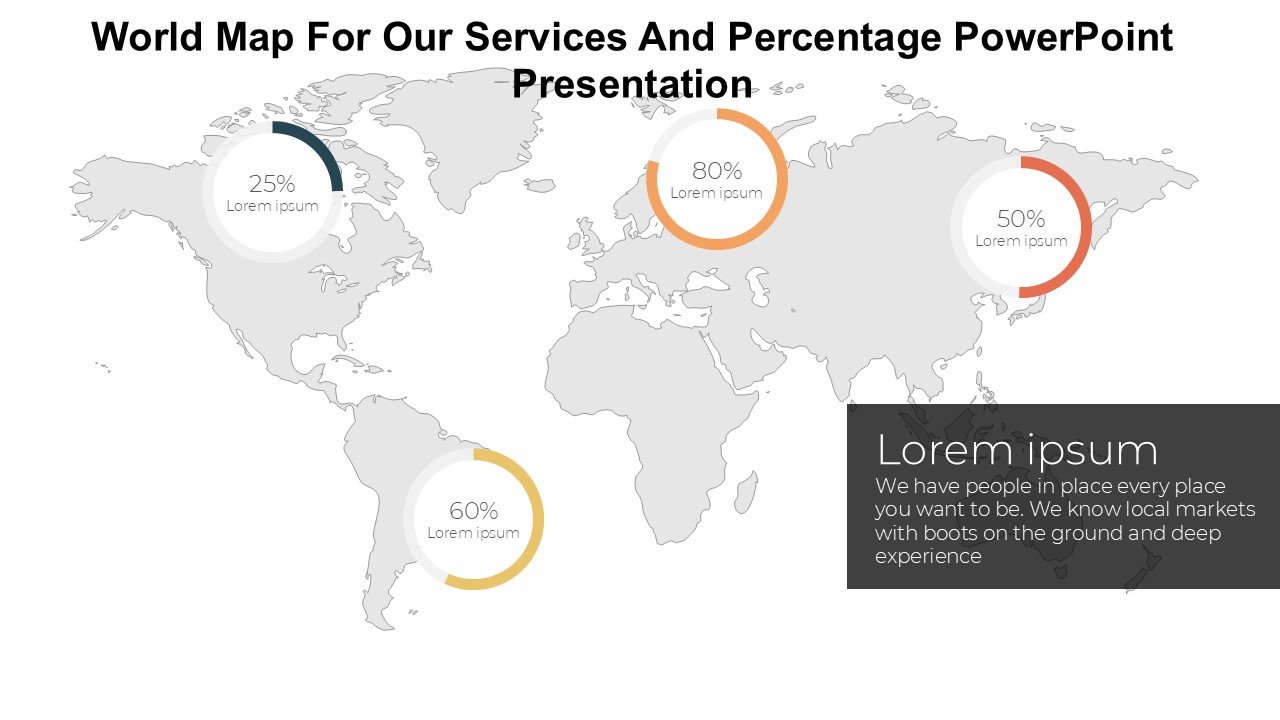
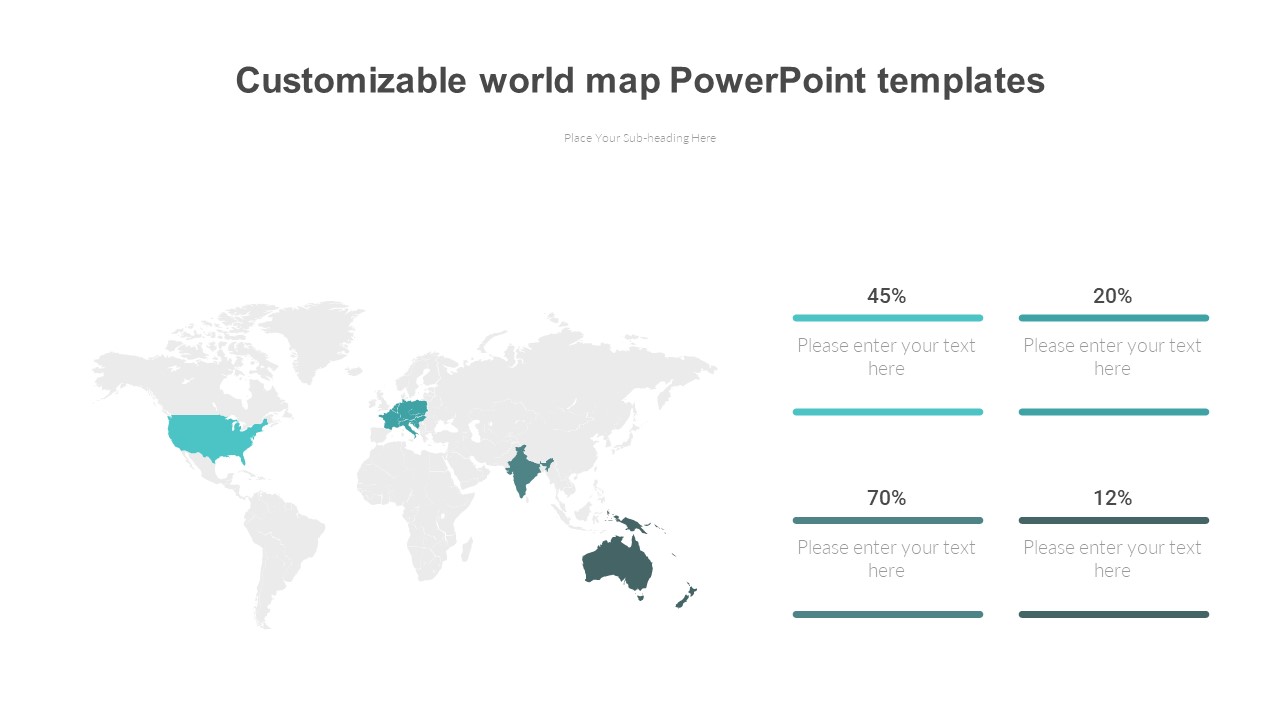
The World Map For Our Services And Percentage PowerPoint Presentation PPT template is an essential resource for professionals, educators, and advocates looking to display geographical data alongside statistical information effectively. This presentation template is meticulously designed to cater to users who require a visual representation of services or data spread across different regions of the world. The slide template integrates the use of a world map with customizable percentage markers, making it an invaluable asset for presenting global statistics and services distribution in a visually engaging and understandable manner.
This PPT slide is tailored for use in various professional settings, including international business presentations, educational lectures on global demographics or economics, and advocacy groups aiming to highlight issues on a worldwide scale. The design is clean and professional, ensuring that the information is the focal point. The template allows for easy insertion of data, and the percentage indicators can be adjusted to reflect the precise values needed for your presentation. Whether you are a business analyst, a teacher, or a campaign coordinator, the World Map For Our Services And Percentage PowerPoint Presentation slide template offers a streamlined solution to convey complex data through straightforward visual enhancements.
The versatility of this PPT presentation template makes it a must-have for anyone who frequently deals with global data. Users can benefit from its adaptability, where each element can be customized to fit the specific needs of the presentation. The template not only aids in the effective communication of data but also ensures that your audience remains engaged through clear, impactful visualizations of your global services or data analysis.
Features:
– Fully editable templates: Customize every element of the slides with ease.
– High-resolution world map: Ensures clarity and visual impact.
– Adjustable percentage indicators: Easily modify these elements to match your specific data.
– Compatible with PowerPoint and Google Slides: Works across popular presentation platforms.
– Professional and clean design: Keeps the audience focused on the essential data.
– Support for multiple languages: Ideal for international presentations.
Use Cases:
– Ideal for business analysts presenting global market shares or company performance.
– Suitable for educators teaching global population distribution or economic conditions.
– Essential for NGOs presenting data on global issues like health, poverty, or environmental impacts.
– Useful for government presentations on international relations or global trade statistics.
– Beneficial for market researchers analyzing global trends and consumer behavior.


There are no reviews yet.