

Description
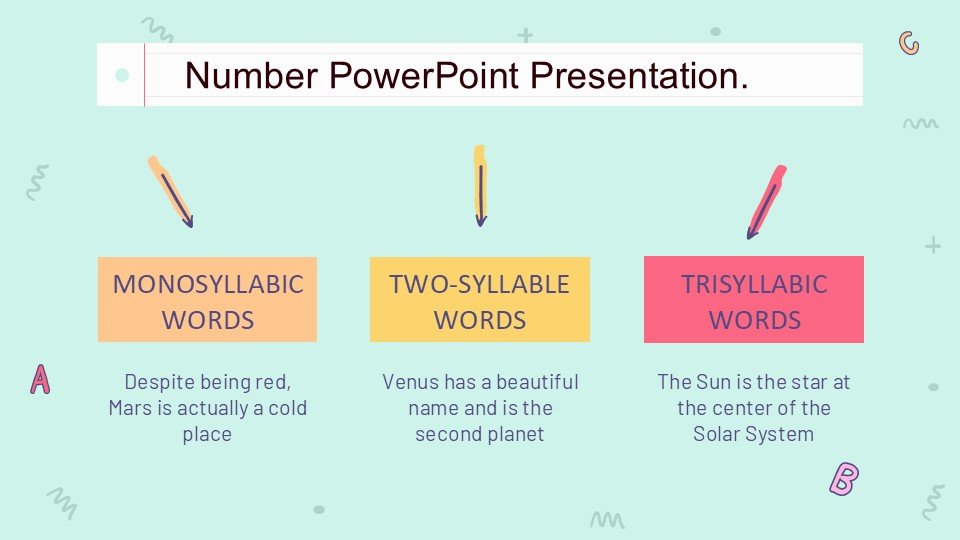
Unlock the power of numbers in your presentations with the Number PowerPoint Presentation slide template, designed meticulously for educators, business professionals, and data advocates. This comprehensive PPT template is crafted to help you convey complex numerical data in a clear, visually engaging manner. Whether you’re teaching a math class, presenting financial reports, or showcasing market research, this presentation template is equipped to handle all your needs.
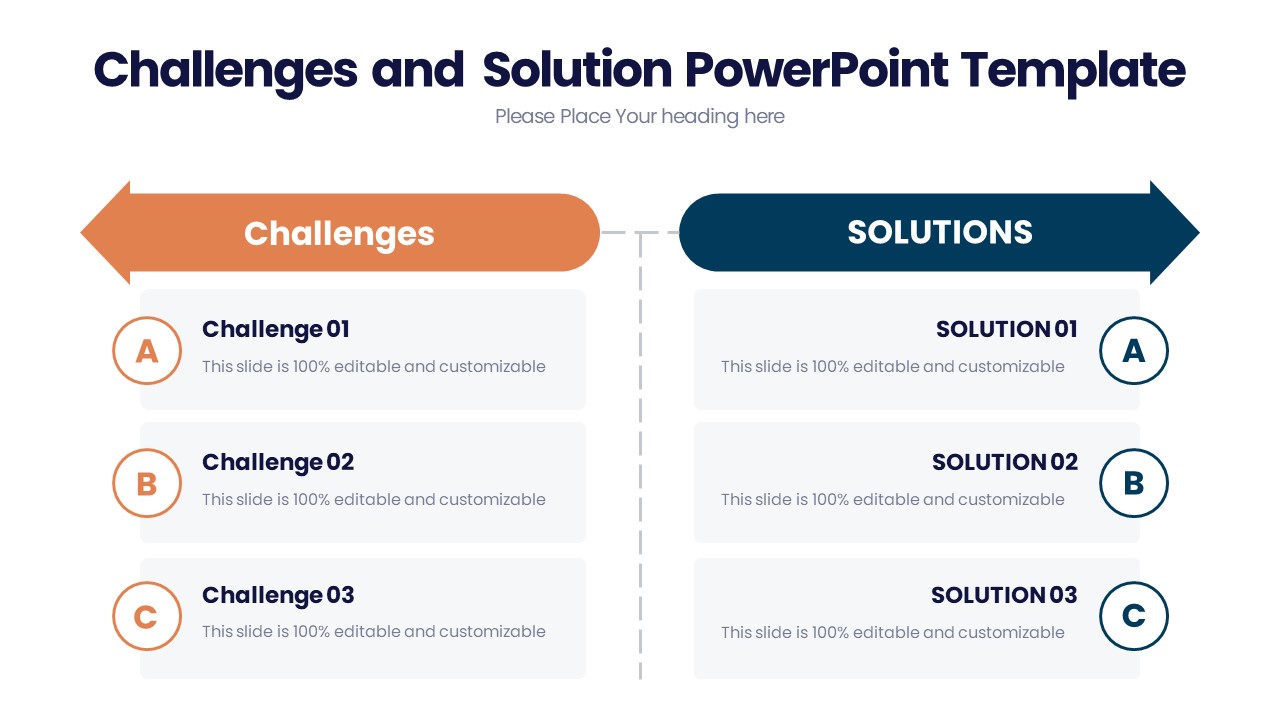
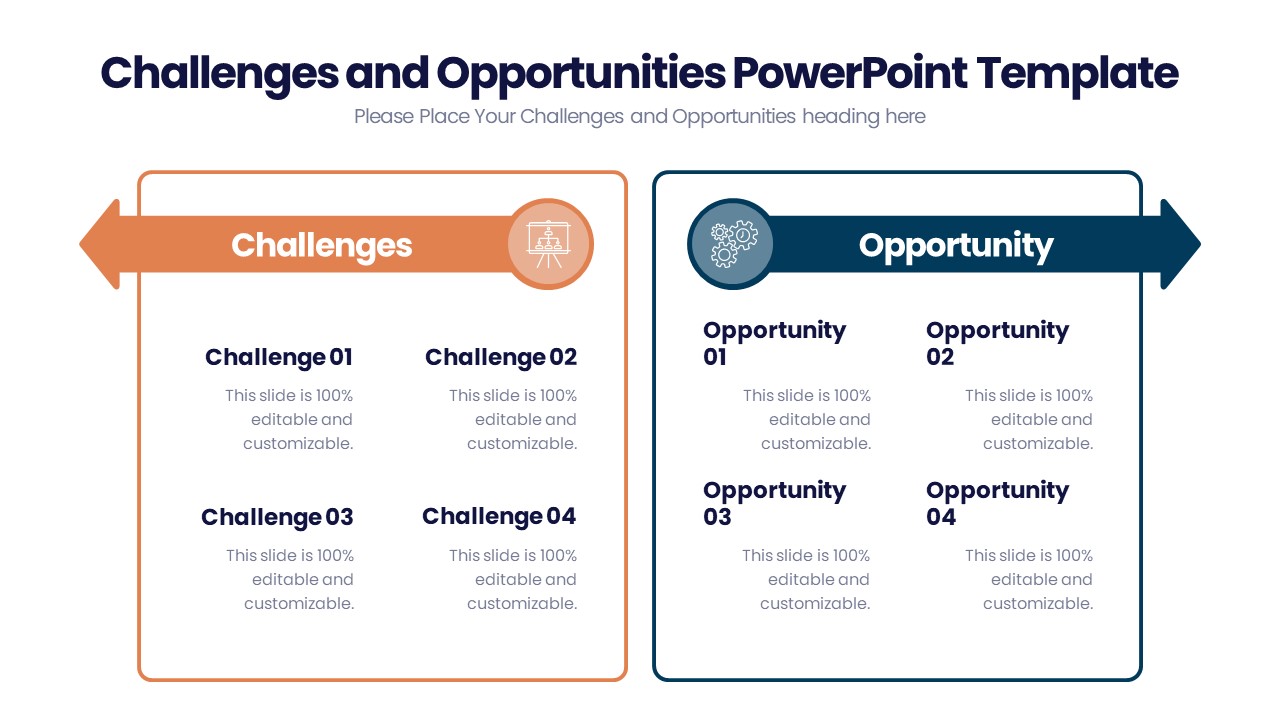
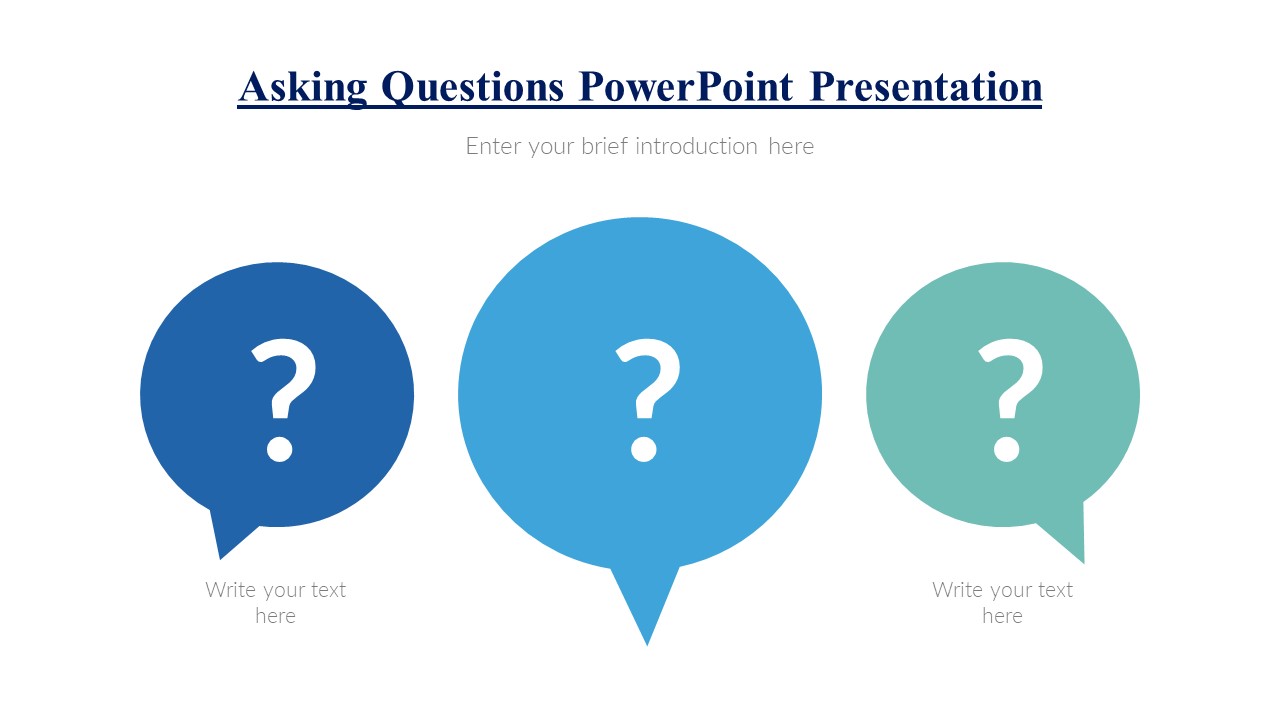
The Number PowerPoint Presentation PPT template includes a variety of slides that are tailored for the display and analysis of numbers. Each slide is thoughtfully designed to enhance readability and viewer engagement. Using vibrant charts, detailed tables, and clear typographic hierarchies, this PPT slide ensures that your numerical data stands out while being easy to understand.
Educators will find this PPT template particularly useful as it helps in breaking down complex mathematical concepts into digestible visuals that students can easily grasp. Professionals in finance or market research will appreciate the ability to present intricate data in a straightforward manner, making their analysis comprehensible to stakeholders and clients. Advocates and researchers can leverage these slides to highlight important statistics and trends that support their causes or studies.
The Number PowerPoint Presentation slide template is not just about aesthetics; it’s about making data accessible. With this PPT template, you can transform raw numbers into powerful stories that inform, educate, and persuade your audience. The intuitive design ensures that you can customize each slide to fit your specific needs, making your presentation truly unique and impactful.
Features:
– Fully editable templates: Customize every element of the slides with ease.
– Compatible with PowerPoint and Google Slides: Works across popular presentation platforms.
– High-quality visuals and graphics: Ensures your presentation looks sharp on all devices.
– Pre-designed charts and tables: Saves time and makes data representation effortless.
– Wide variety of slide layouts: Choose the perfect layout for each segment of your presentation.
– Easy-to-use placeholders: Drag and drop images and adjust text boxes quickly.
Use Cases:
– Ideal for classroom teaching on complex numerical concepts.
– Suitable for financial reporting in corporate settings.
– Perfect for presenting statistical data in research and advocacy.
– Useful for market analysis presentations in business conferences.
– Applicable for workshops or seminars focusing on data literacy.

There are no reviews yet.