

Description
Unlock the full potential of your sales data with the Sales Chart PowerPoint Presentation PPT template, designed to help educators, professionals, and advocates effectively communicate complex sales information in an accessible visual format. This comprehensive PPT slide template is tailored to meet the needs of business professionals who require a reliable and impactful way to present sales trends, performance metrics, and forecasts to stakeholders, teams, or students.
The Sales Chart PowerPoint Presentation slide template is more than just a visual aid; it’s a strategic asset for anyone involved in sales management, business education, or data analysis. Each slide is crafted to ensure clarity and engagement, helping you to illustrate the nuances of sales data without overwhelming your audience. Whether you are presenting quarterly results, annual summaries, or specific case studies, this presentation template provides you with the tools you need to make your data understandable and visually compelling.
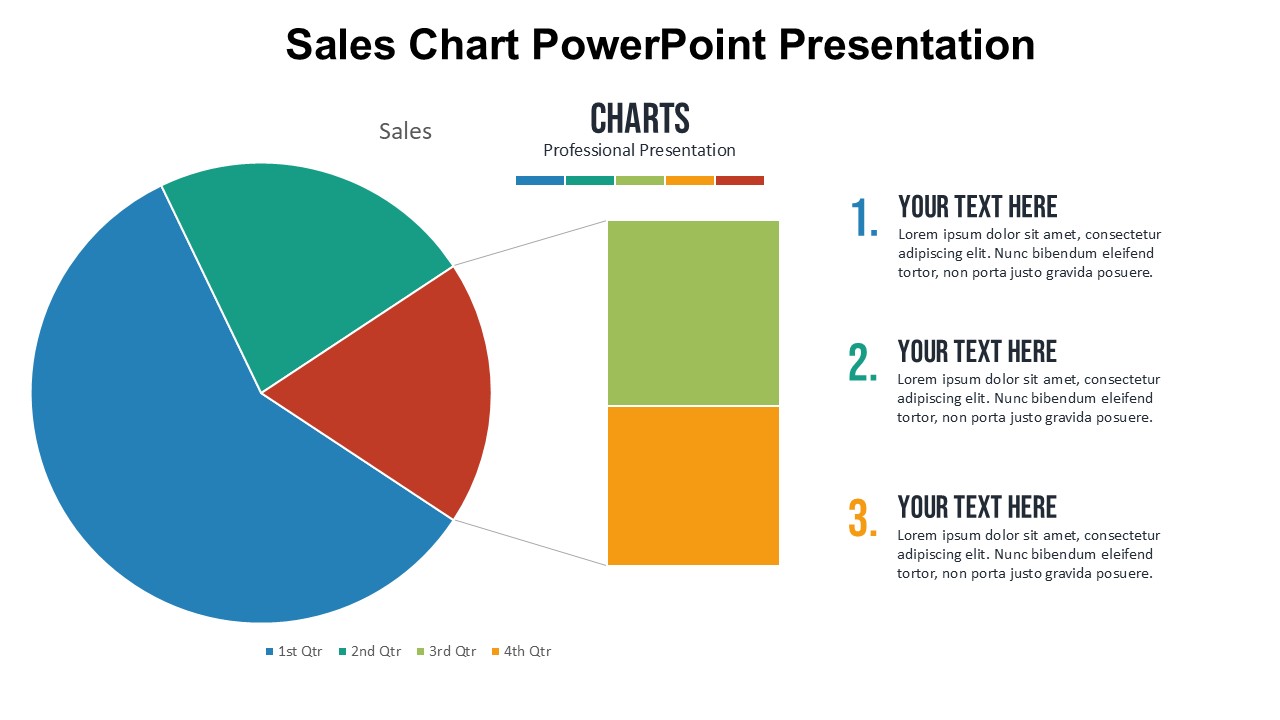
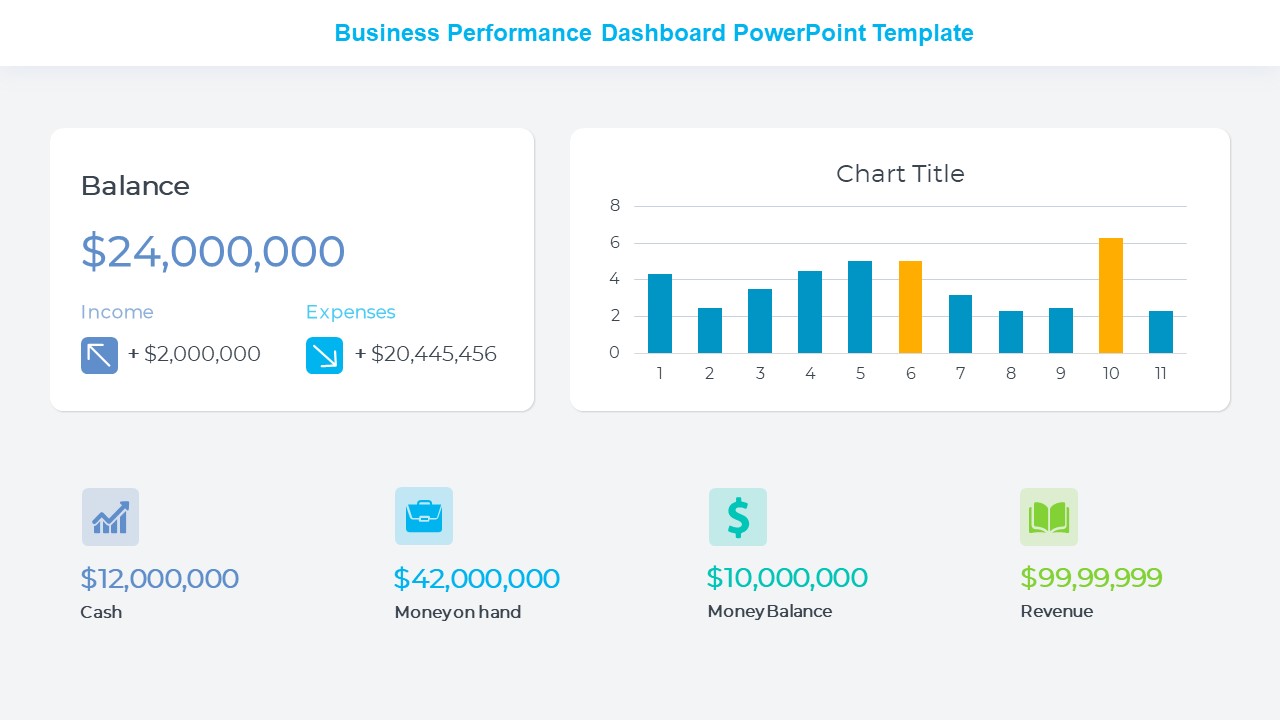
Ideal for business meetings, academic settings, or training sessions, the Sales Chart PowerPoint Presentation PPT template includes a variety of chart styles such as bar graphs, line charts, pie charts, and area charts, each designed to cater to different types of data presentation and analysis needs. The template’s professional design ensures that your presentation will not only deliver the information but also leave a lasting impression on your audience.
With its user-friendly features, the Sales Chart PowerPoint Presentation slide template allows even those with minimal graphic design experience to create polished and professional presentations. The flexibility of the template means it can be easily adapted to suit various industries and contexts, from corporate sales teams aiming to boost internal communications to educators seeking to illustrate textbook concepts in business studies.
Incorporate the Sales Chart PowerPoint Presentation PPT template into your toolkit today and transform raw data into powerful stories that drive decision-making and educational outcomes.
Features:
– Fully editable templates: Customize every element of the slides with ease.
– High-quality graphics: Ensures clear visibility in large conference rooms or classrooms.
– Versatile chart options: Includes a range of chart types to suit different data sets.
– Professional design: Sleek, clean aesthetic aligns with corporate and educational standards.
– Easy to use: Intuitive setup for quick customization, no expert skills required.
– Compatibility with PowerPoint and Google Slides: Use on your preferred presentation platform.
Use Cases:
– Ideal for corporate sales meetings to discuss performance and strategies.
– Suitable for business school lectures on market analysis and trends.
– Useful in workshops for teaching data visualization techniques.
– Effective for annual business reviews to highlight year-over-year growth.
– Beneficial for non-profit organizations to present fundraising results to stakeholders.


There are no reviews yet.