

Description
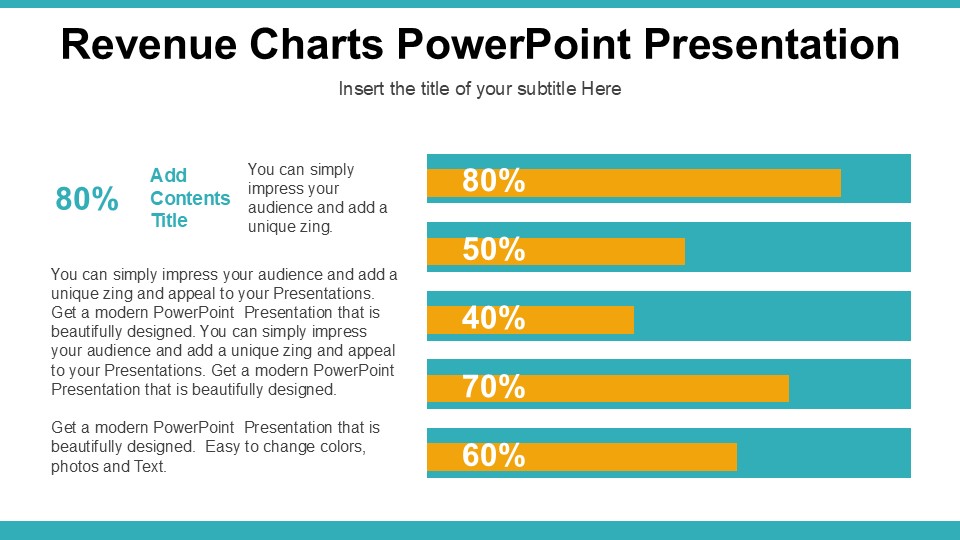
Revenue Charts PowerPoint Presentation is a versatile tool for businesses to showcase their financial performance, projections, and growth trends in a visually appealing manner. This professionally designed presentation template includes a variety of revenue chart designs that can be easily customized to suit your specific needs.
The Revenue Charts PowerPoint Presentation features a range of chart styles, including line graphs, bar charts, pie charts, and more, allowing you to effectively communicate complex financial data in a clear and concise way. Whether you are preparing a quarterly report, annual review, or investor presentation, this template provides the perfect platform to highlight key revenue metrics and insights.
With fully editable templates, users can easily customize the color schemes, fonts, and data points to match their branding guidelines and create a cohesive and professional presentation. The drag-and-drop functionality makes it simple to add or remove elements, rearrange slides, and update charts with the latest revenue figures. Additionally, the template includes helpful tips and guidelines on how to present financial data effectively, ensuring that your audience can easily understand and interpret the information presented.
Overall, the Revenue Charts PowerPoint Presentation is a valuable asset for businesses looking to enhance their financial reporting and analysis capabilities. Whether you are a financial analyst, business owner, or corporate executive, this template provides a comprehensive set of tools to effectively communicate your revenue performance and drive informed decision-making.


There are no reviews yet.