


Description
The Profit And Loss Graph PowerPoint Presentation PPT template is a comprehensive and meticulously designed slide template that serves as an invaluable resource for educators, business professionals, and financial advocates. This PPT template is tailored specifically to facilitate the presentation of financial data, particularly focusing on the dynamics of profit and loss within a business or project context. The template not only aids in illustrating financial outcomes with clarity and precision but also enhances the understanding and engagement of the audience through its visually appealing and informative design.
This presentation template is ideal for anyone who needs to communicate financial information effectively, whether in educational settings, corporate boardrooms, or seminars focused on financial literacy. The Profit And Loss Graph PowerPoint Presentation slide template offers a structured way to present complex financial data in an accessible format, making it easier for the audience to grasp key concepts and results. The templates are designed with professionals in mind, ensuring that they convey information in a format that stakeholders can easily understand and act upon.
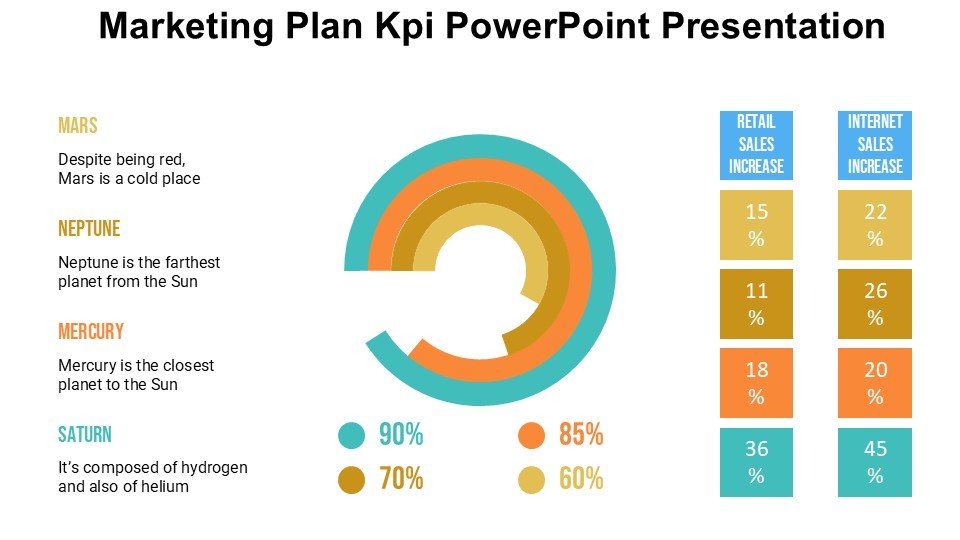
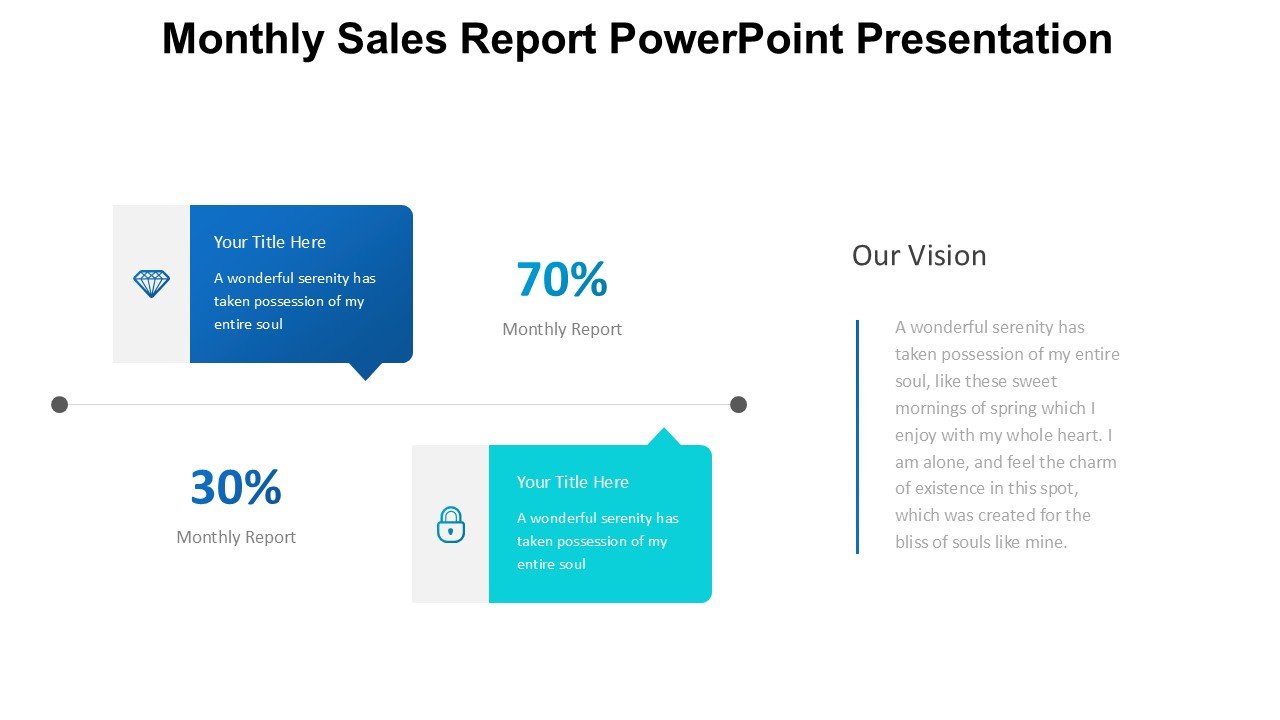
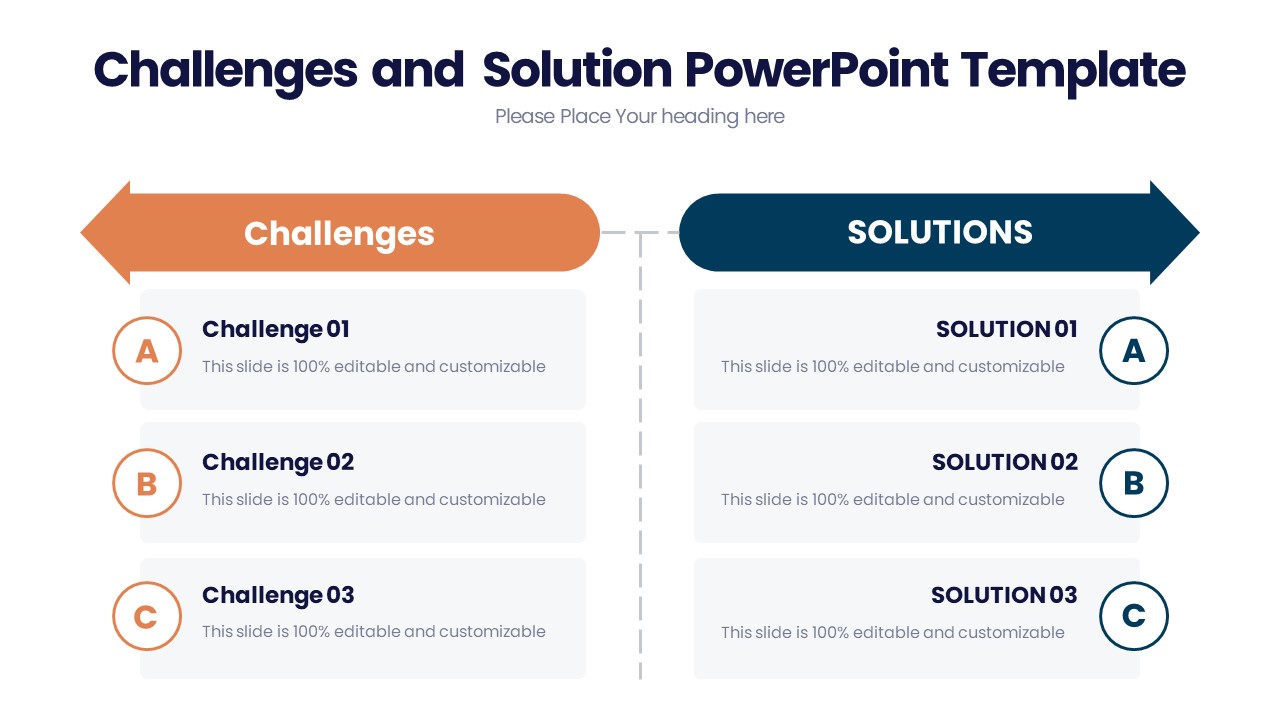
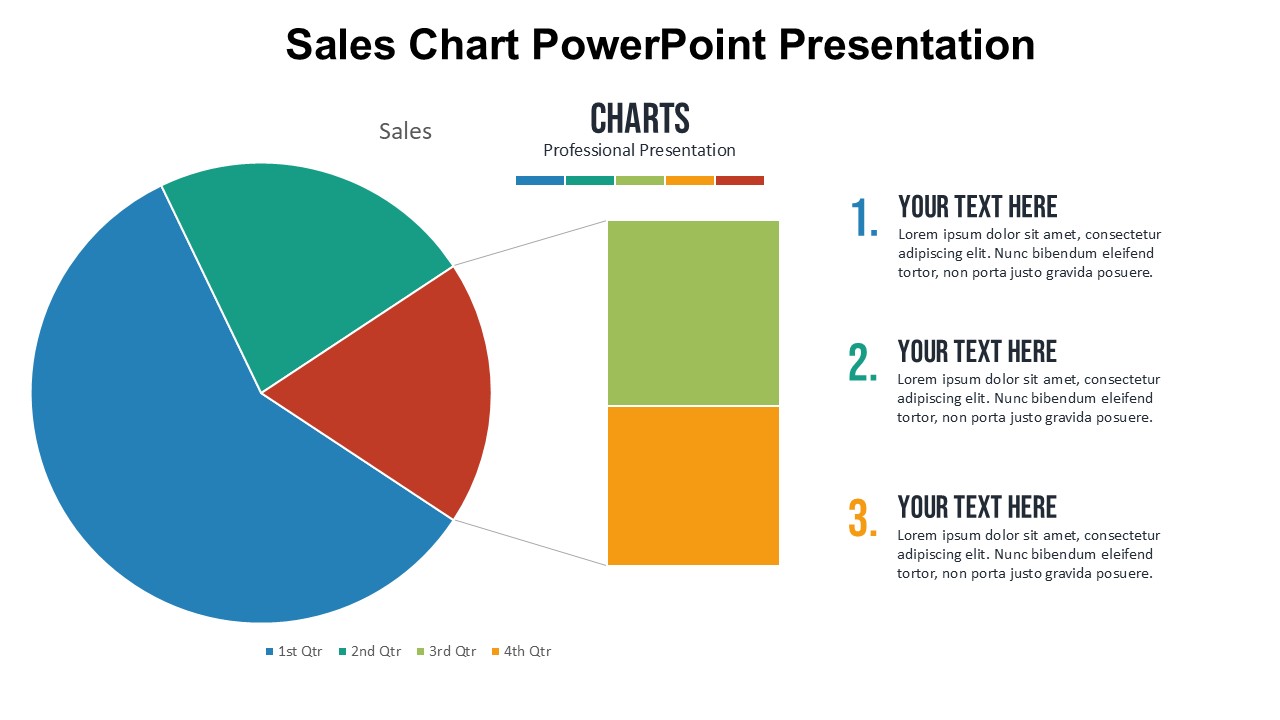
Each slide in the Profit And Loss Graph PowerPoint Presentation PPT template is crafted to ensure that it not only presents data but also tells a story. The use of graphical elements, such as charts and graphs, is optimized to represent financial trends and analyses clearly. This PPT slide ensures that presenters can deliver their message with confidence, supported by robust data visualization tools that underscore key points and figures.
In summary, the Profit And Loss Graph PowerPoint Presentation PPT template is an essential presentation template for anyone needing to outline financial statuses, forecast budgetary outcomes, and engage with audiences over fiscal subjects. It is an indispensable PPT slide for delivering impactful and insightful financial presentations.
Features:
– Fully editable templates: Customize every element of the slides with ease.
– High-quality graphics: Ensures that all visual aids are clear and impactful.
– Professional design: Suitable for corporate environments and formal presentations.
– Data-driven charts and graphs: Simplify the presentation of complex financial data.
– Wide compatibility: Works seamlessly with Microsoft PowerPoint and other presentation software.
Use Cases:
– Ideal for business review meetings to discuss company financials.
– Useful in academic settings for teaching economics or business studies.
– Essential for financial workshops or seminars aiming to educate on profit and loss analysis.
– Beneficial for startups and small businesses during pitch presentations to investors.
– Supports financial advisors in illustrating investment outcomes and forecasts to clients.


There are no reviews yet.