

Description
### Power BI vs. QlikView PowerPoint Presentation
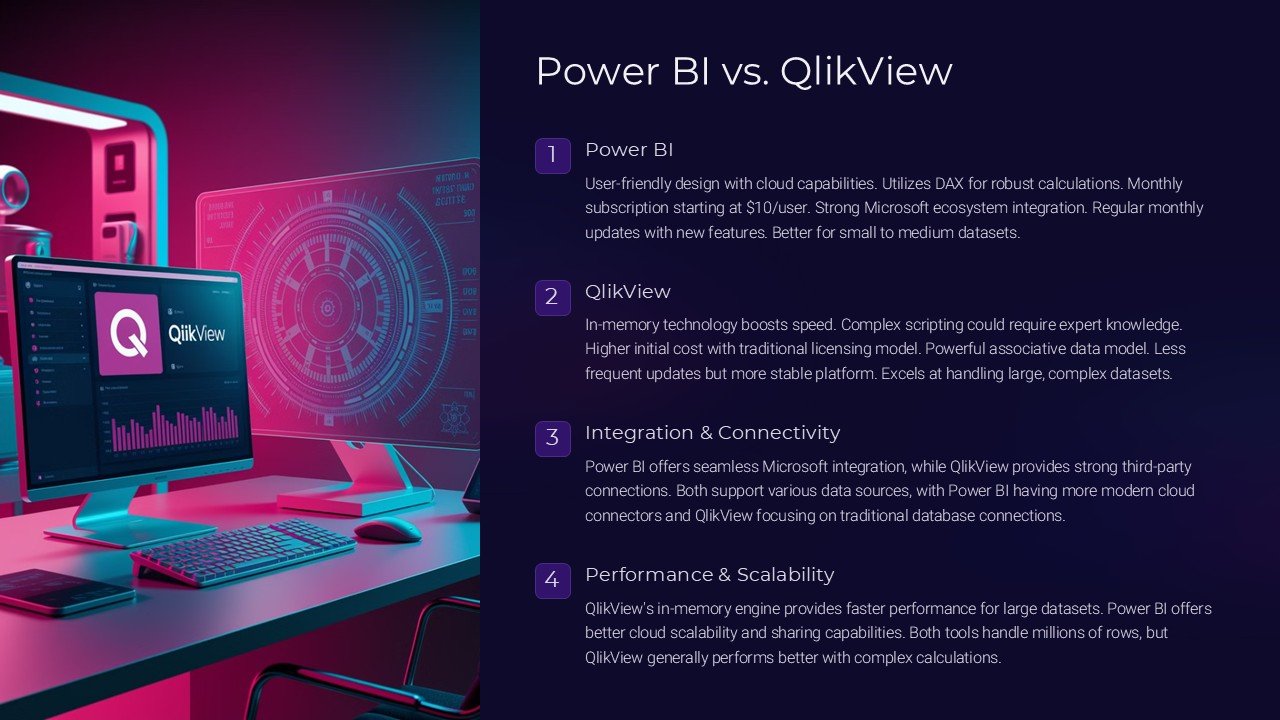
Navigating through the complex landscape of business intelligence tools can be a daunting task. Two giants in the field, Power BI and QlikView, offer robust solutions but understanding their strengths and differences is crucial for making an informed decision. The “Power BI vs. QlikView PowerPoint Presentation” is designed to demystify these platforms, providing a clear, comparative insight into both, enabling businesses and IT professionals to choose the tool that best fits their needs.
This comprehensive PowerPoint presentation begins with an introduction to both Power BI and QlikView, outlining their core features and the unique aspects of each tool. It delves into the history and development of these platforms, setting the stage for a deeper exploration of their functionalities.
The main body of the presentation is structured around a head-to-head comparison of various features. It covers key areas such as data integration capabilities, ease of use, visualization options, data processing speeds, scalability, mobile support, and overall cost-effectiveness. Each feature is carefully analyzed, with pros and cons discussed to give the audience a balanced view.
For instance, the presentation highlights Power BI’s integration with other Microsoft Office products, making it an excellent choice for those already entrenched in the Microsoft ecosystem. Conversely, QlikView’s powerful data association model is explained, showing how it excels in handling complex data scenarios where deep, data-driven insights are required.
Further, the presentation includes case studies and real-world scenarios where businesses have implemented either Power BI or QlikView. These case studies help illustrate how each tool can be utilized in different industries and under various business sizes and types, providing a practical perspective that adds value to the theoretical knowledge shared.
An interactive Q&A section is embedded towards the end of the presentation, encouraging the audience to engage and clarify their doubts, ensuring a comprehensive understanding of both platforms. This makes the presentation not just informative but also interactive.
### Features of the PowerPoint Presentation Templates
– **Fully Editable Templates:** The presentation comes with fully editable PowerPoint templates and Google Slides, allowing you to customize the content according to your specific needs and branding requirements. Whether you need to change colors, adjust layouts, or add your own data, everything can be tailored with ease.
– **Support for PowerPoint and Google Slides:** Designed to be versatile, the templates are compatible with both Microsoft PowerPoint and Google Slides. This feature ensures that regardless of your preferred platform, you can use this presentation effectively.
– **High-Quality Visuals:** With high-quality graphics and charts, the presentation is visually appealing, making complex information easier to understand and more engaging for the audience.
– **Comprehensive Coverage:** Each aspect of Power BI and QlikView is covered in detail, ensuring that viewers walk away with a thorough understanding of both tools.
– **User-Friendly Design:** The templates are designed with the user in mind, ensuring that they are easy to use and navigate, even for those who may not be PowerPoint experts.
This “Power BI vs. QlikView PowerPoint Presentation” is an essential resource for anyone looking to compare these two powerful business intelligence tools. It provides all the necessary information, backed by in-depth analysis and real-world applications, to make a well-informed decision tailored to your specific business needs.


There are no reviews yet.