

Description
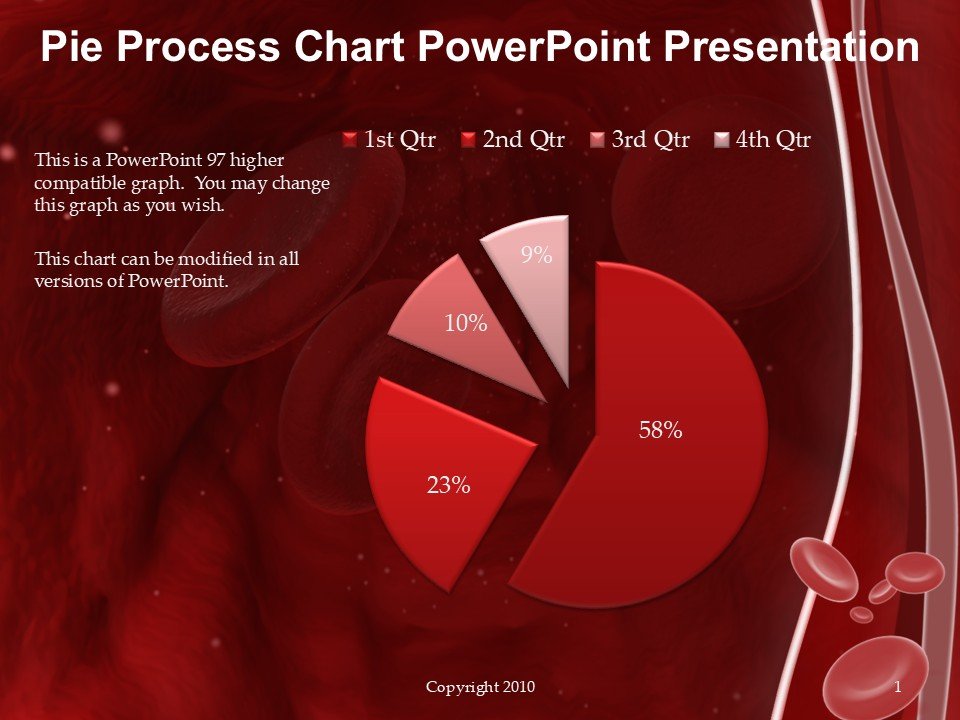
The Pie Process Chart PowerPoint Presentation PPT template is an essential presentation template designed to help educators, professionals, and advocates clearly and effectively present complex processes and data. This PPT slide template utilizes a pie chart format to break down and illustrate the steps of any process, making it easier for audiences to comprehend and retain information. Whether you are a teacher explaining a scientific process to your students, a business professional outlining company workflow, or an advocate presenting statistical data to stakeholders, this PPT template is tailored to meet a wide range of presentation needs.
The Pie Process Chart PowerPoint Presentation slide template is meticulously crafted to ensure high-quality visuals and user-friendly functionality. Each slide within the template features a customizable pie chart, where each segment represents a different phase of the process being discussed. The design is clean and professional, with options to adjust colors, fonts, and text to fit your specific requirements or personal style.
This presentation template is not only a way to show data but also a means to create visually engaging and persuasive PowerPoint presentations. The use of pie charts helps in breaking down information into manageable parts, making complex data accessible and understandable at a glance. This is particularly useful in settings where time is limited and the clarity of information is crucial.
Overall, the Pie Process Chart PowerPoint Presentation PPT template is a versatile and powerful tool for anyone needing to present process-related information in a clear, effective, and visually appealing manner. It is an invaluable resource for making your presentations more impactful and memorable.
Features:
– Fully editable templates: Customize every element of the slides with ease.
– High-quality visuals: Ensures clear and impactful presentations.
– Versatile design: Suitable for a wide range of topics and audiences.
– Easy to use: Simple for beginners and powerful enough for advanced users.
– Compatible with Microsoft PowerPoint: Use on any version of PowerPoint.
Use Cases:
– Ideal for educators teaching complex subjects in a visual format.
– Essential for business professionals presenting company processes or data.
– Useful for advocates explaining research findings or statistical data to an audience.
– Beneficial for students presenting projects or research in a structured manner.
– Suitable for workshops or seminars where visual aids are needed to explain processes.


There are no reviews yet.