

Description
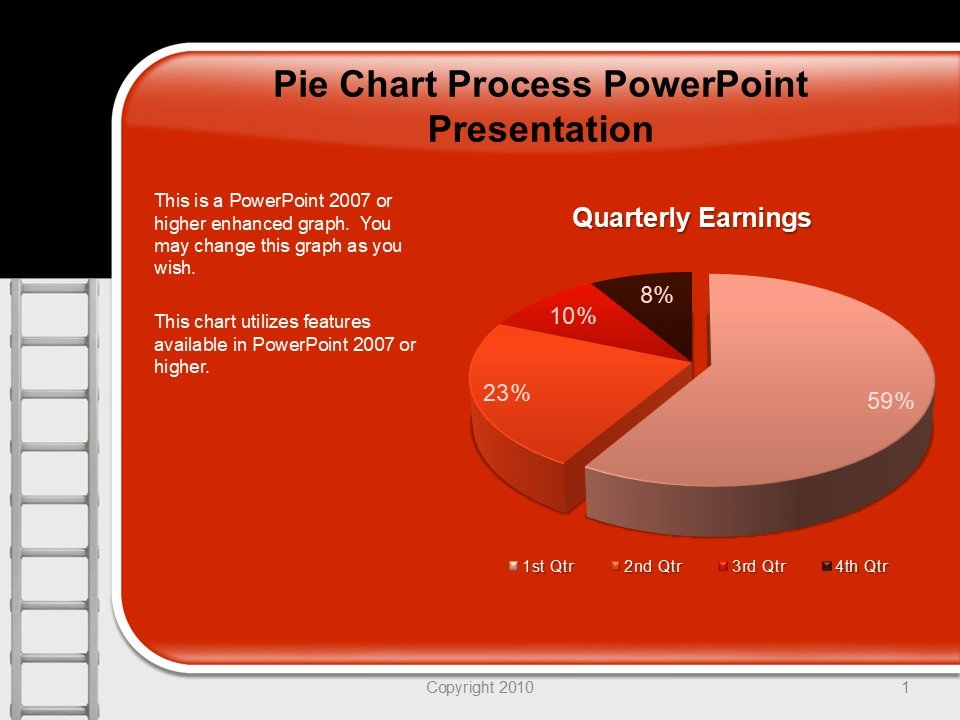
The Pie Chart Process PowerPoint Presentation PPT template is an essential resource designed to enhance the clarity and impact of your data presentations. Tailored for educators, business professionals, and data advocates, this PPT slide template offers a visually engaging way to present complex information. Whether you’re delivering academic lessons, corporate reports, or advocacy messages, the versatility of our template ensures your data is not only seen but understood.
This presentation template is meticulously crafted to cater to a diverse range of presentation needs. It incorporates a series of customizable pie charts, each designed to help you clearly articulate the distribution and relationships of parts to a whole in any dataset. The color schemes and design elements are thoughtfully chosen to make your data presentations as clear as they are compelling.
The Pie Chart Process PowerPoint Presentation slide template is not just about aesthetics; it’s a practical tool in data visualization. It simplifies the process of creating professional and accurate pie charts by providing a framework that can be easily adjusted to fit specific data sets and presentation styles. This makes it particularly useful for those who need to present statistical data in a format that is easily digestible for any audience.
Ideal for use in various settings, from classrooms to boardrooms, the template ensures that your presentations are both professional and persuasive. The intuitive design allows users of all skill levels to create stunning presentations that effectively communicate their message. Each slide is crafted to ensure that your audience can grasp the data insights at a glance, enhancing both understanding and retention.
Incorporating the Pie Chart Process PowerPoint Presentation template into your resources equips you to deliver powerful presentations that can transform complex data into straightforward, impactful visuals. Elevate your presentations and ensure your data makes the powerful impact it deserves with this versatile PPT template.
Features:
– Fully editable templates: Customize every element of the slides with ease.
– High-quality visuals: Ensure your presentations look professional.
– Easy to use: Tailored for users with any level of PowerPoint expertise.
– Versatile design: Suitable for a wide range of presentation contexts.
– Compatible with PowerPoint and Google Slides: Works across popular presentation platforms.
Use Cases:
– Ideal for classroom teaching to illustrate statistical concepts.
– Perfect for corporate presentations to display market research or financial data.
– Essential for non-profit presentations to showcase survey results or funding distributions.
– Useful for government reports where data transparency and clarity are required.
– Suitable for workshops or seminars focusing on data interpretation skills.


There are no reviews yet.