

Description
Master the art of effective communication with our Monthly Sales Report PowerPoint Presentation PPT template. Designed meticulously for professionals, educators, and advocates, this presentation template is a comprehensive tool for anyone looking to present sales data compellingly and clearly. The Monthly Sales Report PowerPoint Presentation slide template is specifically tailored to meet the needs of business professionals who require a reliable and structured method to report monthly sales achievements, analyze trends, and strategize for future performance enhancements.
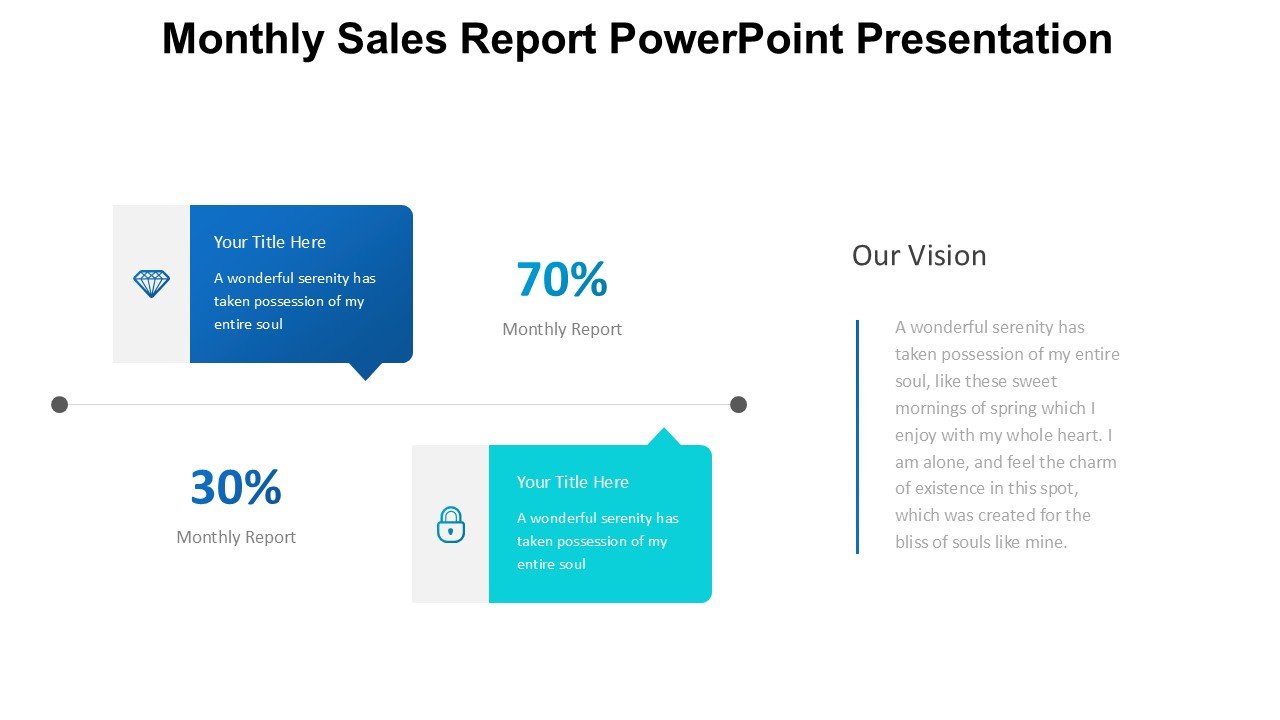
The slide template includes a variety of charts, graphs, and tables that are essential for a detailed presentation of sales data. Each slide is crafted to not only present data but also to interpret and explain the implications of that data effectively. This PPT template ensures that your audience can easily follow your analysis and derive meaningful insights without being overwhelmed by complex data or jargon.
The Monthly Sales Report PowerPoint Presentation PPT template is also an invaluable resource for educators who are teaching courses in business, marketing, or statistics. It provides a real-world application of data analysis and business reporting that can be crucial for students’ understanding and engagement. Advocates who need to present data to support their causes will find the narrative-driven format of the presentation template especially useful, as it allows for clear storytelling and impactful data representation.
This PPT slide is designed not only for its functionality but also for its adaptability and ease of use. The template can be customized to fit the branding requirements of your organization or personal style preferences. Whether you’re presenting to a board, a classroom, or at a conference, this PPT template ensures professionalism and clarity.
Dive into your next meeting with confidence using our Monthly Sales Report PowerPoint Presentation slide template, and let your data not just speak, but engage and persuade.
Features:
– Fully editable templates: Customize every element of the slides with ease.
– Compatible with PowerPoint and Google Slides: Works across popular presentation platforms.
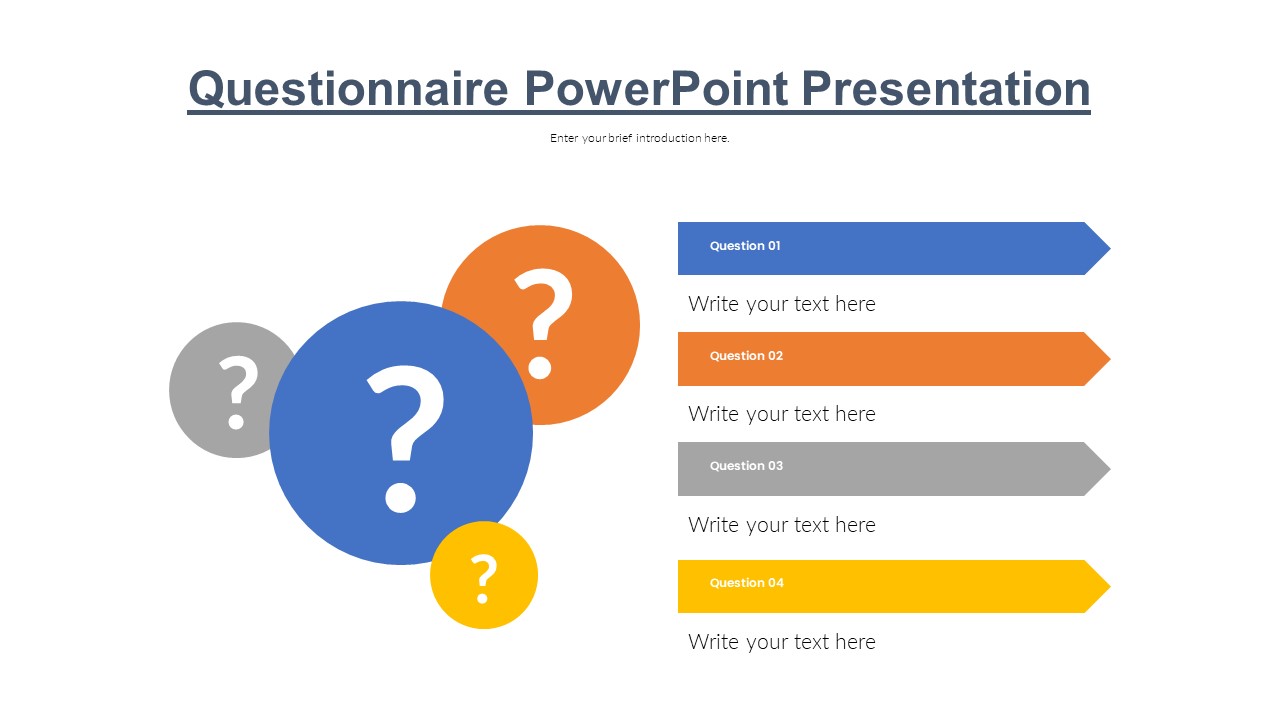
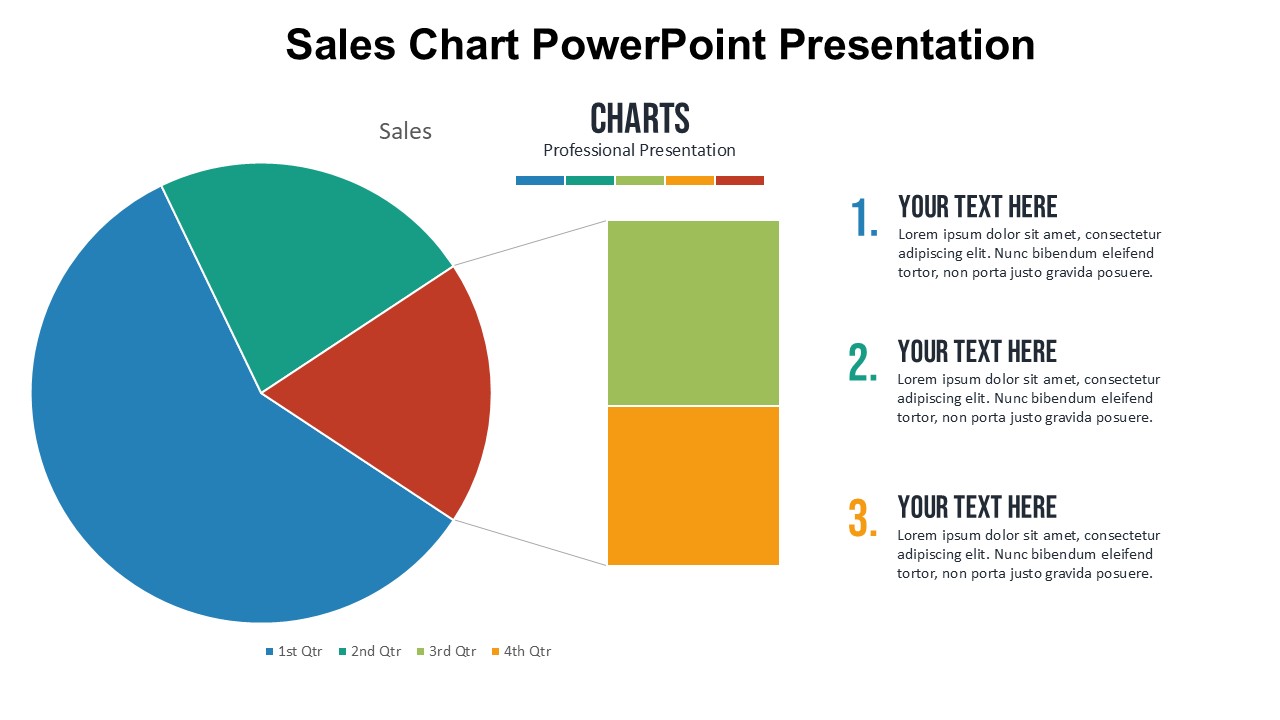
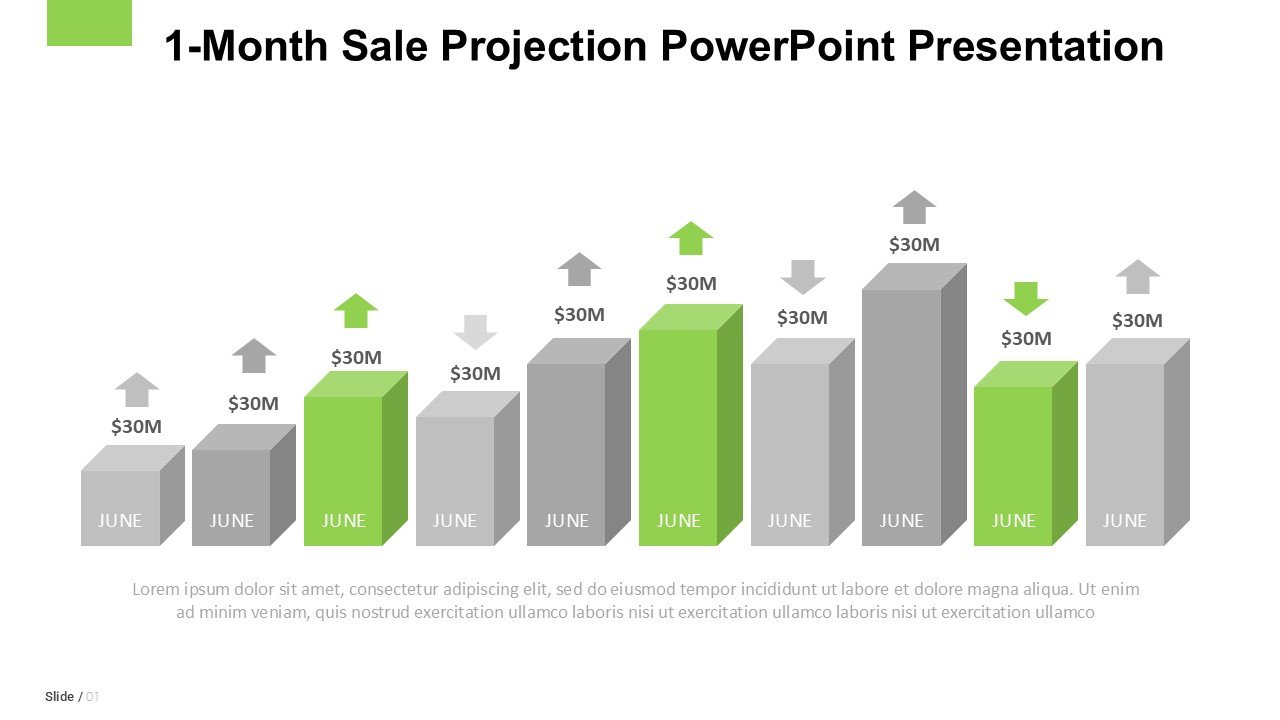
– Wide variety of charts and graphs: Includes bar charts, pie charts, line graphs, and tables.
– Professional design: Sleek and clean layout that maintains the focus on your data.
– User-friendly interface: Simple navigation and easy-to-understand setup.
– High-resolution visuals: Ensures that your presentation looks sharp and engaging on all screens.
Use Cases:
– Ideal for monthly business review meetings.
– Suitable for educational purposes in business and marketing classes.
– Effective for advocacy groups presenting data to stakeholders.
– Useful for individual professionals aiming to impress with clear data-driven presentations.
– Appropriate for corporate training on data presentation and analysis skills.


There are no reviews yet.