

Description
Are you looking for a professional and visually appealing PowerPoint presentation to showcase your business’s key metrics and KPIs? Look no further than the Highlighting Key Metrics and KPIs PowerPoint Presentation template.
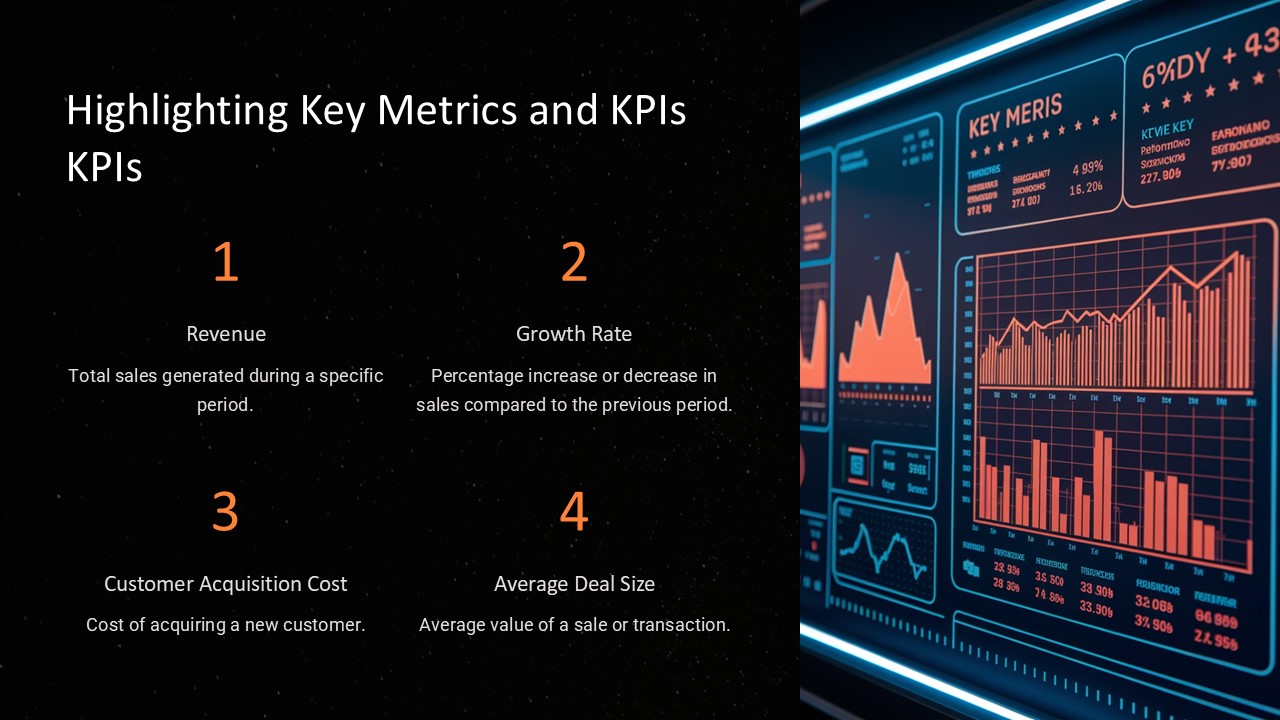
This modern and sleek presentation template is designed to help you effectively communicate your business performance indicators to your team, stakeholders, or clients. With a clean and organized layout, this template allows you to highlight important data points, trends, and insights with ease.
The Highlighting Key Metrics and KPIs PowerPoint Presentation template features a range of slide designs, including graphs, charts, tables, and infographics, to help you present your data in a clear and compelling way. Whether you’re reporting on sales figures, financial performance, marketing metrics, or any other key indicators, this template has got you covered.
Key Features:
1. Fully editable slides: Customize the content, colors, fonts, and images to suit your brand and messaging.
2. Data-driven charts and graphs: Easily input your data into the pre-designed charts and graphs for quick and accurate visualization.
3. Infographics: Use the included infographics to add context and visual interest to your key metrics and KPIs.
4. Professional design: Impress your audience with a polished and professional presentation that showcases your data in a clear and impactful way.
5. Easy to use: The template is user-friendly and can be easily edited by anyone with basic PowerPoint skills.
Whether you’re presenting to your team, investors, or clients, the Highlighting Key Metrics and KPIs PowerPoint Presentation template is sure to help you effectively communicate your business performance and drive informed decision-making. Download this template today and take your presentations to the next level.


There are no reviews yet.