


Description
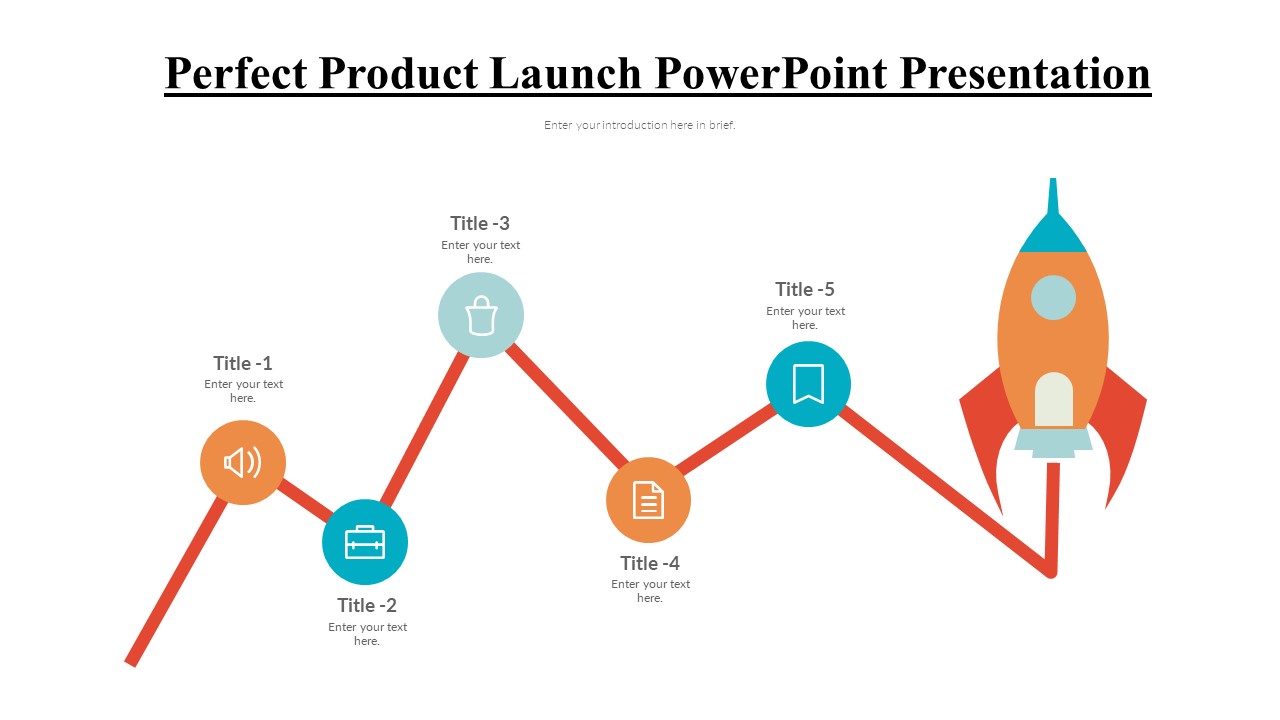
**Introducing the Growth Chart PowerPoint Presentation Template** – A Dynamic Tool for Visualizing Progress and Trends
Unlock the potential of your data with the Growth Chart PowerPoint Presentation Template, an essential tool designed for businesses, educators, and personal use to effectively communicate growth trends and projections. This meticulously crafted template is not just a visual aid; it’s a comprehensive solution that transforms complex data into clear, compelling visual stories, making it easier for your audience to understand and engage with your insights.
**Versatile and User-Friendly Design**
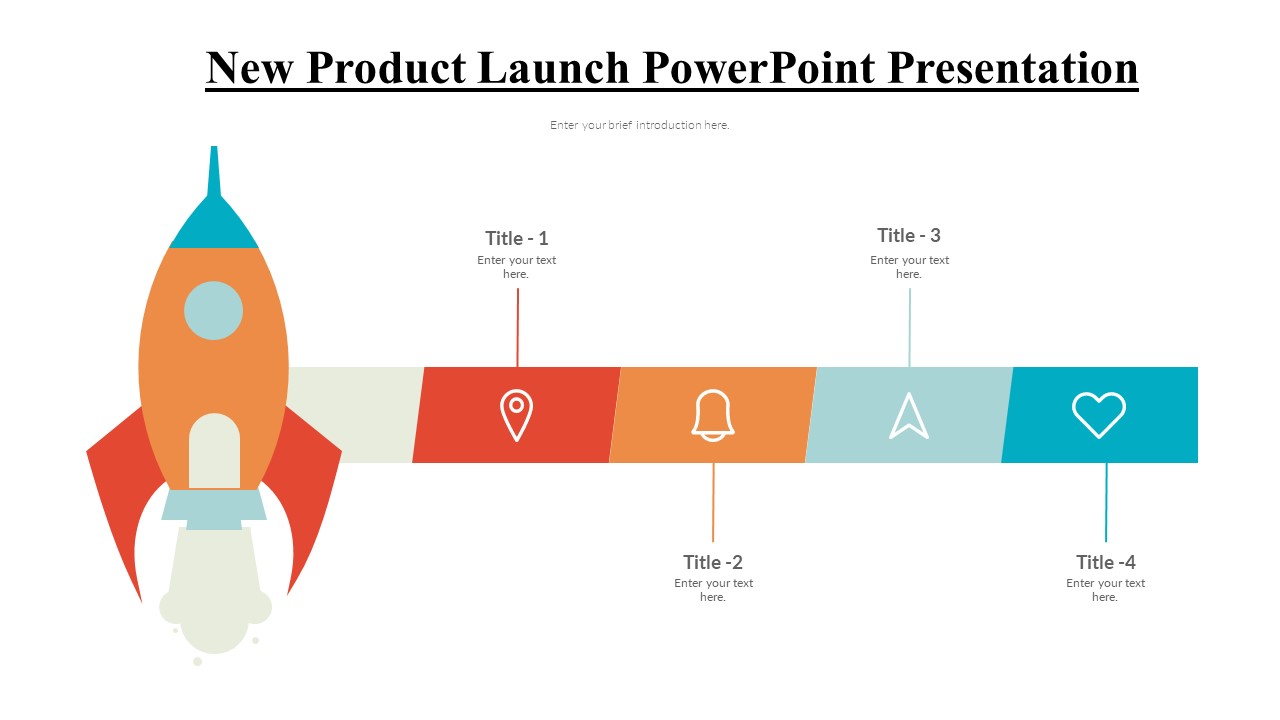
The Growth Chart PowerPoint Presentation Template is crafted to support a wide range of applications, from business performance reviews and market research to academic presentations and personal project tracking. Whether you are a business professional analyzing quarterly sales growth, a researcher presenting study trends, or a teacher illustrating student progress, this template provides a robust framework to showcase your data dynamically.
This template includes a variety of chart styles such as bar graphs, line charts, and pie charts, each designed to cater to different types of data representation. The color schemes are professional yet appealing, ensuring that your presentations not only convey the message but also hold the attention of your audience.
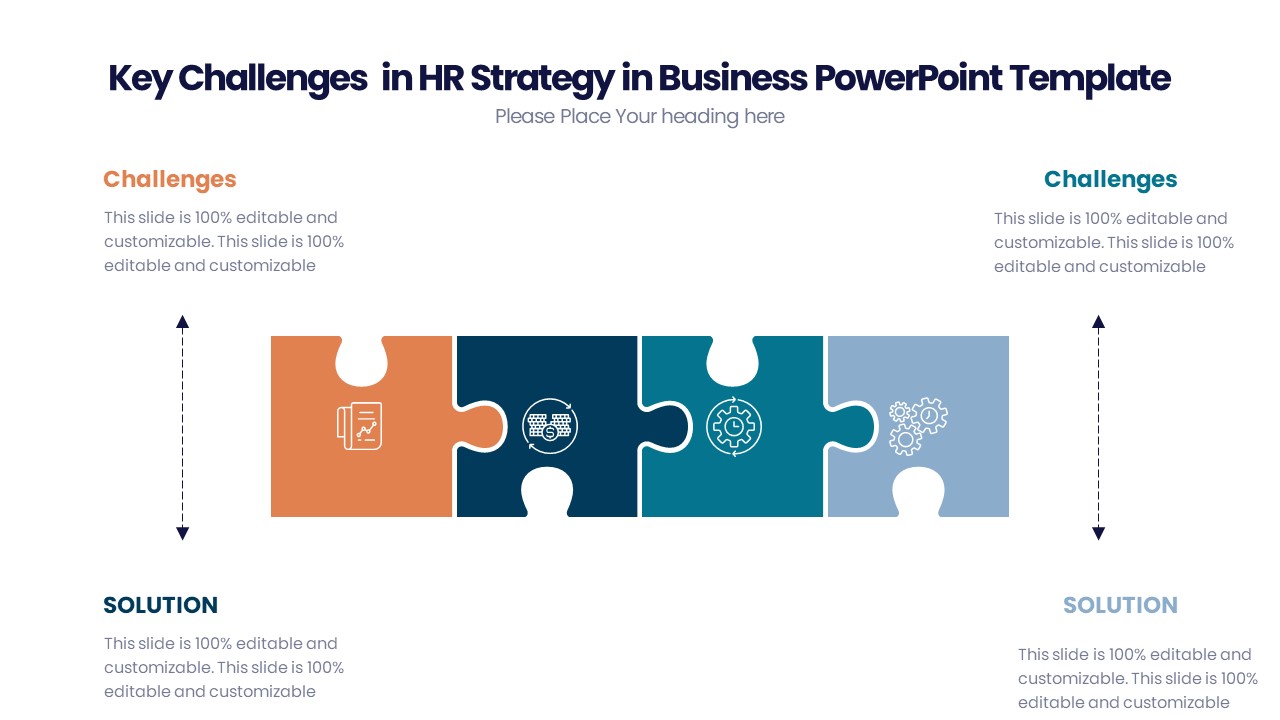
**Customizable for Unique Requirements**
One of the greatest strengths of this template lies in its customizability. Each element, from color palettes to font styles, is fully editable to ensure that it aligns perfectly with your branding or personal preference. This level of customization is facilitated through an intuitive design that does not require advanced skills in PowerPoint; anyone can adapt it to meet their specific needs.
**Compatibility and Accessibility**
The Growth Chart PowerPoint Presentation Template is designed for ease of use across various platforms. It is fully compatible with the latest versions of PowerPoint, ensuring smooth performance and integration. For those who prefer different software, this template also supports Google Slides, making it accessible to a wider audience and various user preferences.
**Features:**
– **Fully Editable Templates**: Every aspect of the template can be customized. Adjust the text, change colors, and modify shapes without any quality compromise. Tailor your charts specifically to your data needs and presentation style.
– **Supports PowerPoint and Google Slides**: Whether you are a PowerPoint user or a Google Slides enthusiast, this template works seamlessly across both platforms, providing flexibility and convenience.
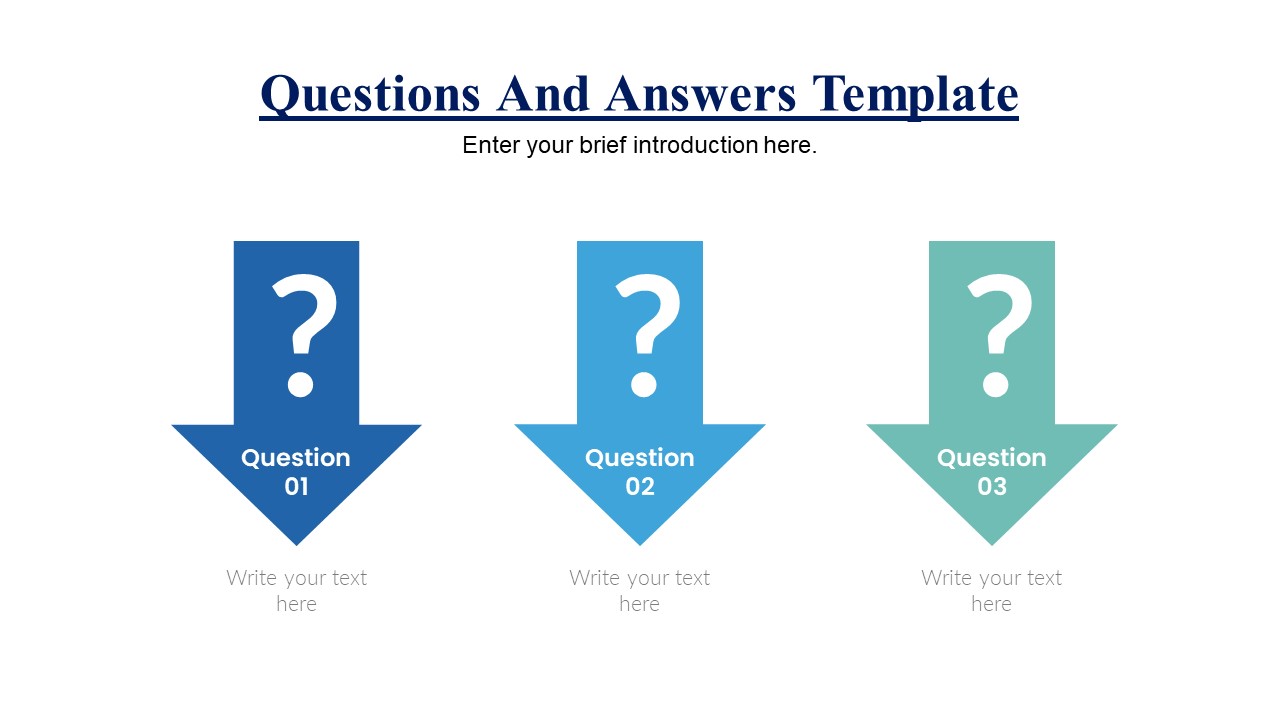
– **Diverse Chart Options**: Equipped with a range of chart types including histograms, area charts, and scatter plots. This variety allows for effective representation of different data types and trends.
– **Professional Aesthetics**: Designed with a professional color palette and clean layout to maintain an authoritative look while being eye-catching.
– **Easy to Use**: You do not need to be a tech wizard to use this template. It is user-friendly and comes with instructions for customizing your presentation.
**Conclusion**
The Growth Chart PowerPoint Presentation Template is more than just a tool; it is a strategic asset for anyone needing to present growth-related data compellingly and persuasively. It is ideal for corporate executives, marketing analysts, educators, students, and even personal use. Elevate your presentations and convey your growth story with clarity and impact using this top-tier PowerPoint template.

There are no reviews yet.