

Description
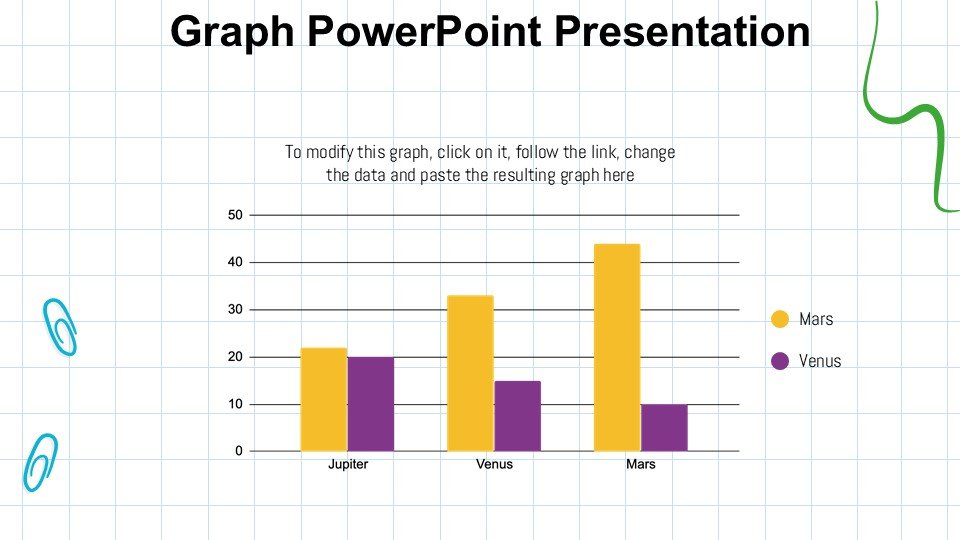
The Graph PowerPoint Presentation PPT template is a meticulously designed slide template crafted to meet the needs of educators, professionals, and advocates who require clear and impactful visual aids for presenting complex data. This comprehensive PPT template is tailored to enhance the presentation of statistical data, trends, and quantitative analysis through well-structured and visually appealing graphs and charts.
Each slide in the Graph PowerPoint Presentation slide template is engineered for clarity, precision, and professional appeal, ensuring that your audience can easily grasp intricate data without being overwhelmed. The design elements incorporated in this presentation template are chosen to facilitate easy comprehension and retention of information, making it an indispensable resource for anyone aiming to make informed decisions based on data.
This presentation template is versatile and can be used across various fields such as education, business, healthcare, and non-profit organizations. Whether you are a teacher illustrating complex mathematical concepts, a business analyst presenting quarterly sales trends, or an advocate showcasing statistical evidence to support a cause, the Graph PowerPoint Presentation PPT template is designed to elevate your data presentation to the next level.
Integrated into each slide of this presentation template are tools that allow for customization to suit specific needs or branding requirements. The flexibility of the design ensures that it can adapt to different presentation styles and environments, from academic lectures to corporate boardroom meetings.
Features:
– Fully editable templates: Customize every element of the slides with ease.
– High-quality graph designs: Includes a variety of graph styles such as bar charts, line graphs, and pie charts.
– Compatibility with PowerPoint and Google Slides: Ensures usability across different platforms.
– Professional layout and design: Crafted for maximum impact and readability.
– Wide range of color schemes: Choose from multiple color options to match your branding or presentation theme.
– Slide variety: Contains slides for introduction, data display, analysis, and conclusion to facilitate a complete presentation flow.
Use Cases:
– Ideal for educators teaching subjects that involve statistical data and graph interpretation.
– Essential for business professionals who need to present sales, financial forecasts, or market analysis.
– Suitable for healthcare professionals presenting medical research statistics or patient data trends.
– Beneficial for non-profit organizations advocating for causes with data-driven presentations to stakeholders or donors.
– Useful for students and academics who require a professional format for presenting their research findings or thesis data.


There are no reviews yet.