

Description
Introducing the “Designing Reports and Dashboards PowerPoint Presentation” – a comprehensive toolkit tailored for professionals who aim to master the art of creating insightful and impactful data visualizations. Whether you’re a business analyst, data scientist, or a marketing manager, this PowerPoint presentation is designed to provide you with the foundational skills and advanced techniques needed to design reports and dashboards that truly speak volumes.
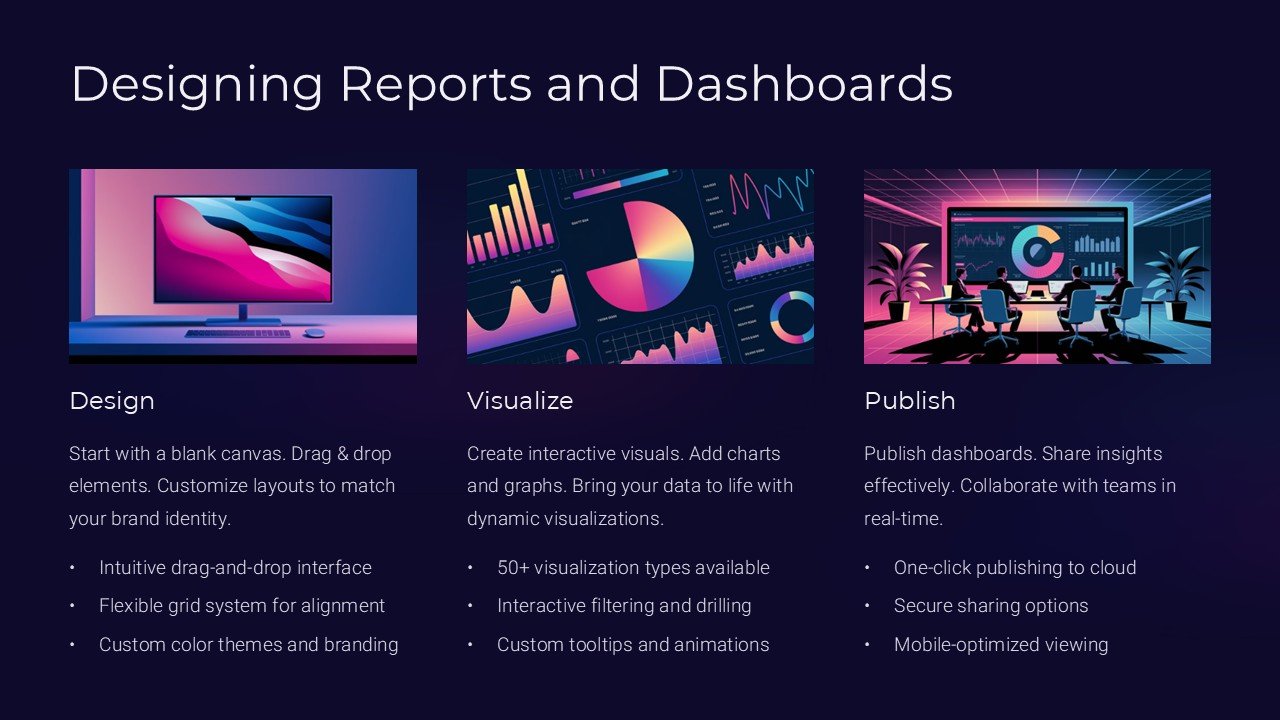
This meticulously crafted presentation is not just a collection of templates; it’s a complete educational journey. It begins with the basics of dashboard design, including understanding your audience, selecting the right type of charts and graphs, and the principles of effective visual communication. As you progress, you’ll delve into more sophisticated topics such as integrating data from multiple sources, using advanced analytical tools to uncover deeper insights, and tips for making your reports interactive.
What sets this PowerPoint presentation apart is its practical approach. Each slide is structured to not only provide theoretical knowledge but also to offer practical examples and tips that can be applied immediately. The slides are enriched with high-quality graphics, easy-to-follow explanations, and case studies that demonstrate real-world application of the concepts discussed.
**Key Features:**
1. **Fully Editable Templates:** Each slide is crafted to be fully editable, allowing you to customize the content, style, and layout to fit your specific needs and branding requirements. Whether you’re using PowerPoint or Google Slides, you’ll find these templates flexible and easy to adapt.
2. **Supports PowerPoint and Google Slides:** No matter which platform you prefer, this presentation is compatible with both Microsoft PowerPoint and Google Slides. This ensures you can work on your reports and dashboards using the tools that you are most comfortable with.
3. **User-Friendly Design:** All templates are designed with the user in mind. They feature a clean, professional layout that makes information easy to digest. The logical flow from one slide to the next ensures that your audience grasps the story behind the data without getting overwhelmed.
4. **Rich Visual Elements:** With a wide array of chart types, icons, and graphical elements, the presentation makes it simple to visualize complex data effectively. These visual elements are not only attractive but are selected to enhance understanding and retention of information.
5. **Comprehensive Coverage:** From the fundamentals of data presentation to advanced customization techniques, this PowerPoint presentation covers everything you need to know to create dynamic reports and dashboards. It’s an invaluable resource for anyone looking to enhance their reporting skills.
6. **Interactive Features:** Learn how to make interactive dashboards that allow users to drill down into the specifics. The presentation includes examples and instructions on creating dynamic and interactive elements to make your data exploration as intuitive as possible.
The “Designing Reports and Dashboards PowerPoint Presentation” is more than just a set of slides – it’s a gateway to mastering the art of data presentation. Whether you’re preparing a report for an executive meeting, a quarterly business review, or need to communicate complex data insights to stakeholders, this PowerPoint presentation will equip you with the skills and tools to do so with confidence and clarity. Embrace the power of effective data visualization and transform the way you communicate data in your organization.


There are no reviews yet.