

Description
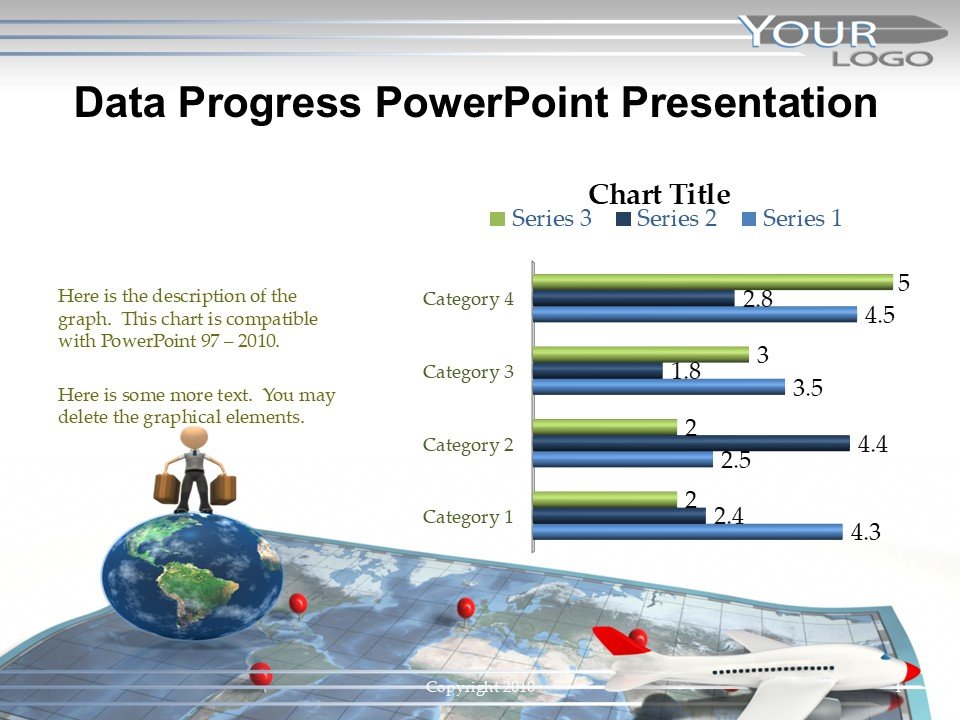
The Data Progress PowerPoint Presentation PPT template is a meticulously designed slide template essential for educators, business professionals, and data advocates who need to present data-driven insights effectively. This PPT template is crafted to facilitate the clear visualization of data progress and trends in various fields such as business, academia, and non-profit organizations.
Our Data Progress PowerPoint Presentation slide template includes a range of pre-designed slides that cater to the needs of presenting complex data in an accessible and visually appealing manner. Each slide is structured to assist in demonstrating the progression, comparisons, and outcomes of data analyzed over a certain period. This presentation template serves as an excellent resource for anyone engaged in data analysis, project management, or academic research, providing them with the tools to convey their findings persuasively and coherently.
The design of the PPT slides emphasizes clarity, precision, and professionalism, suitable for high-stakes meetings, academic conferences, or community advocacy presentations. The use of graphs, charts, and timelines within the templates allows for a dynamic presentation of data that can be easily interpreted by any audience, helping to drive your point home effectively.
Whether you are a teacher illustrating student performance, a business analyst reporting on quarterly sales, or a public health advocate discussing policy impacts, the Data Progress PowerPoint Presentation PPT template is tailored to help you deliver your message with confidence and clarity. Its ease of use and adaptability make it a go-to choice for professionals across various sectors looking to make a significant impact with their presentations.
Features:
– Fully editable templates: Customize every element of the slides with ease.
– Professional and clean design: Engage your audience with visually appealing graphics.
– Wide variety of charts and diagrams: Includes pie charts, bar graphs, line charts, and more.
– High-resolution visuals: Ensures clear display on all screen sizes and devices.
– Slide transitions and animations: Add a professional touch to your presentations.
– Compatibility with PowerPoint and Google Slides: Works across popular presentation platforms.
– Instant download and ready to use: Save time with templates that are prepared for immediate application.
Use Cases:
– Ideal for classroom teaching on data management and statistics.
– Suitable for business meetings to present sales data and market trends.
– Essential for non-profit organizations to report on campaign results or funding progress.
– Useful for government presentations on policy impact assessments.
– Effective in scientific conferences to illustrate research findings and hypotheses.
– Supports financial analysts in showcasing economic forecasts and financial health.


There are no reviews yet.