

Description
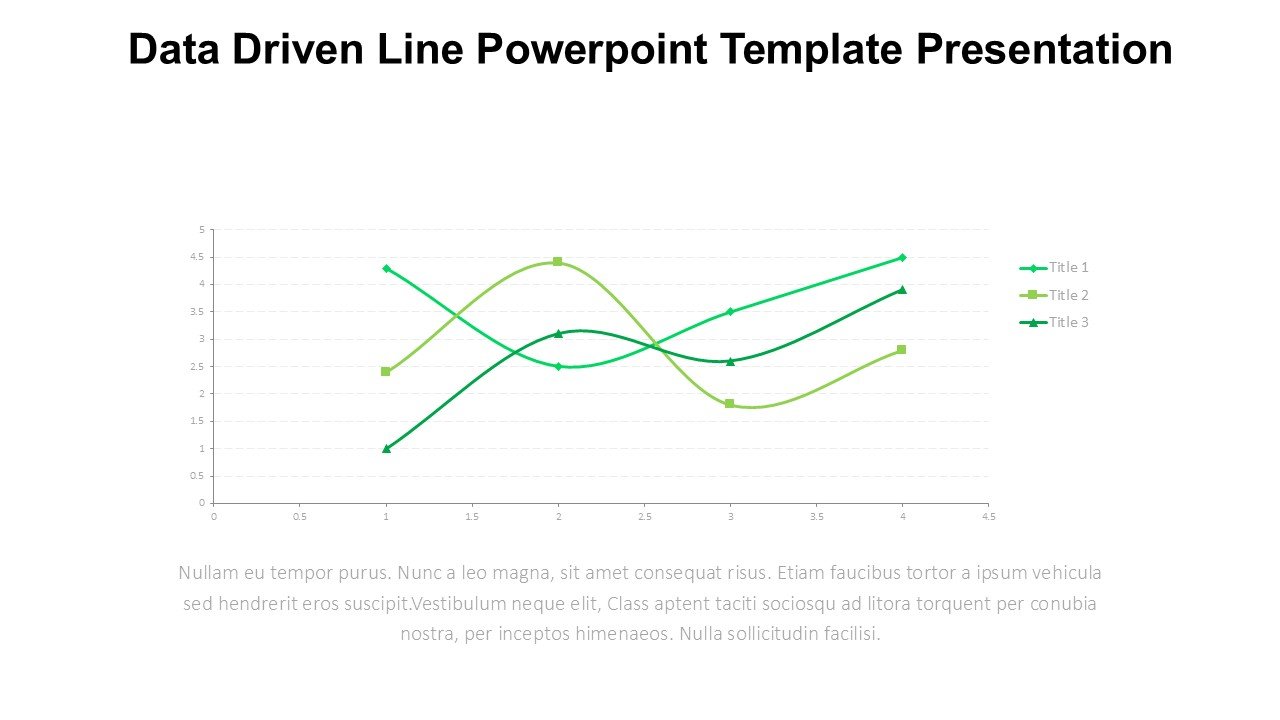
The Data Driven Line PowerPoint Template Presentation PPT template is an essential resource for professionals, educators, and advocates who require a reliable and impactful way to present complex data trends and forecasts. This meticulously designed slide template integrates the elegance of minimalist design with the functionality of data visualization, enabling users to convey data-intensive information in an accessible and persuasive manner.
Crafted to support a variety of professional settings, the Data Driven Line PowerPoint Template Presentation slide template offers a suite of slides that are perfect for displaying data comparisons, timelines, and progression analytics. Each slide is designed to hold data-driven line graphs which are not only visually appealing but also dynamically adjustable to reflect specific data sets accurately. This feature makes it an invaluable asset for detailed reporting and analytical presentations which require precision and clarity.
The versatility of the Data Driven Line PowerPoint Template Presentation PPT template makes it suitable for a wide audience. Educators can utilize these slides to illustrate trends in educational data or student performance, ensuring that information is represented in an understandable format. Business professionals can leverage the template to showcase market trends, financial forecasts, or company performance over time during stakeholder meetings or corporate presentations. Advocates and researchers can effectively use the slides to present statistical evidence or progress on social issues, making complex data comprehensible and impactful for varied audiences.
Furthermore, the intuitive design means that even users with minimal graphic design experience can customize the slides to fit their specific needs, making the Data Driven Line PowerPoint Template Presentation a handy addition to any presentation toolkit.
Features:
– Fully editable templates: Customize every element of the slides with ease.
– Dynamic data-driven line graphs: Easily adjust graphs to reflect your specific data sets.
– High-quality visual design: Professional and clean aesthetic that holds audience attention.
– Compatibility with PowerPoint and Google Slides: Ensures usability across different platforms.
– Versatile slide layouts: Suitable for a wide range of data presentation needs.
Use Cases:
– Ideal for corporate presentations detailing company growth or market trends.
– Useful in educational settings for illustrating statistical data or performance metrics.
– Effective for advocacy groups presenting data to support policy changes or awareness campaigns.
– Suitable for researchers sharing findings in a visually engaging format.
– Beneficial for financial analysts projecting fiscal trends and outcomes.


There are no reviews yet.