

Description
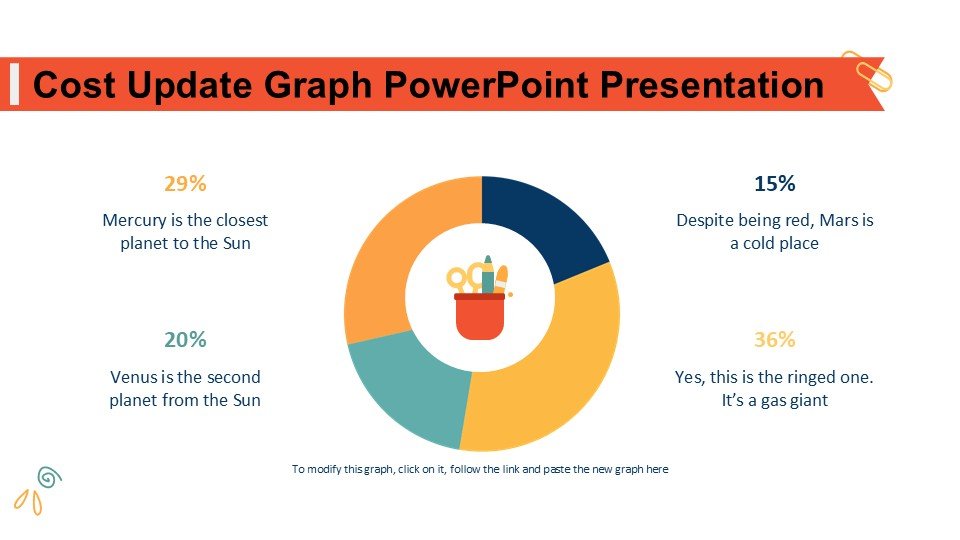
In today’s dynamic economic environment, staying updated with cost changes and their implications is crucial for businesses and educational institutions alike. The Cost Update Graph PowerPoint Presentation PPT template is a specialized presentation template designed to help professionals, educators, and advocates effectively visualize and communicate cost updates and financial data. This PPT slide offers a structured way to present complex data in an easily understandable format, enabling users to make informed decisions and strategies.
The Cost Update Graph PowerPoint Presentation slide template is ideal for financial analysts, project managers, business educators, and advocacy groups who need to present changes in costs over time, budget reviews, or financial forecasts. With its comprehensive set of slides, this PPT template allows users to showcase data trends, compare costs, and highlight financial outcomes through well-designed graphical elements. The presentation template is tailored to support clear and impactful communication, ensuring that every slide resonates with the audience and enhances their understanding of the subject matter.
Each slide in the Cost Update Graph PowerPoint Presentation PPT template is crafted with precision and attention to detail, incorporating charts, graphs, and textual content blocks that are fully customizable to suit various presentation needs. Whether you’re presenting to senior management, a classroom of students, or a group of stakeholders, this PPT slide ensures your financial data presentation is both professional and compelling.
Features:
– Fully editable templates: Customize every element of the slides with ease.
– Includes a variety of graph styles: Bar charts, line graphs, and pie charts to represent different data types.
– High-quality visuals: Professional designs ensure your presentations look sharp and engaging.
– Easy to use: Intuitive design makes it simple for anyone to update and modify.
– Compatible with PowerPoint and Google Slides: Works across popular presentation platforms.
Use Cases:
– Ideal for monthly or quarterly financial reviews within corporations.
– Useful for educational purposes, teaching students about economic principles and cost management.
– Perfect for workshops or seminars focusing on cost efficiency and financial planning.
– Suitable for advocacy presentations highlighting the financial impacts of policy changes or economic conditions.
This comprehensive, easy-to-use PPT template is an essential resource for anyone who needs to keep stakeholders informed about financial dynamics effectively. The Cost Update Graph PowerPoint Presentation slide template not only aids in presenting data but also ensures that your audience grasitates the full impact of cost-related decisions and changes in your organization or field.

There are no reviews yet.