

Description
Introducing the Cardinality and Cross Filtering PowerPoint Presentation, a meticulously designed tool built to enhance your understanding and presentation of complex data interactions within business intelligence environments. This comprehensive presentation template is tailored for professionals eager to communicate intricate data relationships effectively and intuitively.
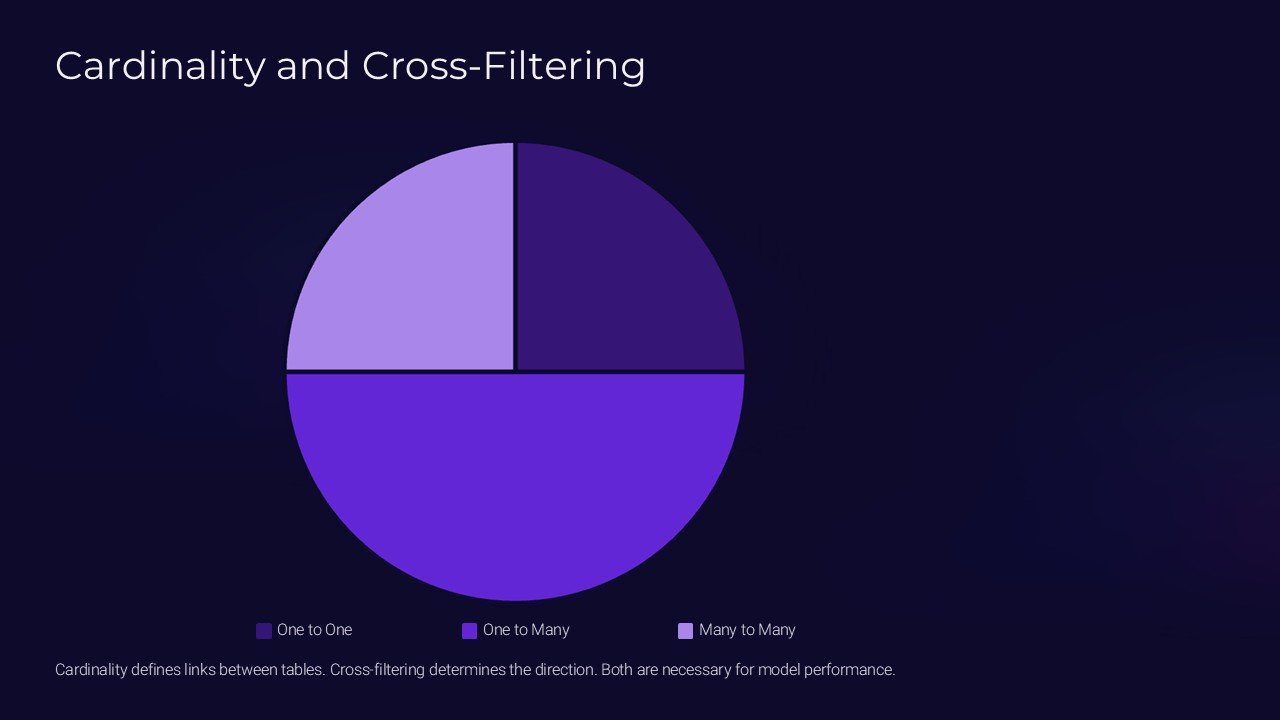
The Cardinality and Cross Filtering PowerPoint Presentation is not just a set of slides; it’s a strategic ally in data analysis and visualization. Cardinality, a fundamental concept in database management and data analysis, refers to the uniqueness of data values contained in a particular column of a database table. Understanding cardinality helps in optimizing database queries and ensuring efficient data management. Cross filtering, on the other hand, involves the ability to filter one data set based on selections in another, crucial for deep dives into correlated data sets and multifaceted data exploration.
This presentation template is crafted to aid users in demonstrating how cardinality affects database performance and how cross filtering can be implemented in various business scenarios to extract meaningful insights. Whether you’re a data analyst, business intelligence professional, or a manager overseeing IT infrastructure, this PowerPoint presentation provides a clear and structured way to convey complex data concepts to your audience.
**Features of the Cardinality and Cross Filtering PowerPoint Presentation:**
1. **Fully Editable Templates**: Every slide is designed to be fully editable, allowing you to customize content according to your specific needs and preferences. Whether it’s tweaking the text, changing backgrounds, or modifying the color schemes, you have complete control over how you present your data.
2. **Compatibility with PowerPoint and Google Slides**: Flexibility is key in today’s varied tech environment. That’s why this presentation is compatible with both Microsoft PowerPoint and Google Slides, making it accessible and functional no matter what platform you or your audience prefers.
3. **Professional Design**: Each slide boasts a professional design that aligns with current trends in presentation aesthetics. Engage your audience with clean layouts, dynamic graphics, and a coherent visual flow that guides them through the complexities of cardinality and cross filtering.
4. **Comprehensive Coverage**: From basic concepts to advanced applications, the slides cover a range of topics related to cardinality and cross filtering. This includes practical examples, case studies, and theoretical explanations to cater to both newcomers and seasoned professionals in the data field.
5. **User-friendly Visuals**: Diagrams, charts, and infographics are integrated throughout the presentation to help demystify complex data interactions. These visuals aid in the retention of information and make technical content accessible to all audience members.
6. **Ready-to-use Slides**: Save time with slides that are pre-designed for immediate use. Whether you’re preparing for a last-minute meeting or a scheduled conference, this presentation allows you to set up quickly without compromising on quality.
The Cardinality and Cross Filtering PowerPoint Presentation is an essential tool for anyone looking to enhance their presentations on data management and analysis. It not only educates but also empowers professionals to make informed decisions based on clear, visually compelling data narratives. Equip yourself with this powerful presentation template and turn complex data concepts into understandable, impactful information.


There are no reviews yet.