

Description
The Bar Data Chart Template For PowerPoint Presentation slide template is a meticulously designed PPT template that serves as a vital resource for educators, business professionals, and advocates aiming to present complex data in an accessible and visually appealing format. This presentation template provides a structured way to display statistical data, trends, and comparisons through bar charts, which are integral for making informed decisions and conveying information clearly and effectively.
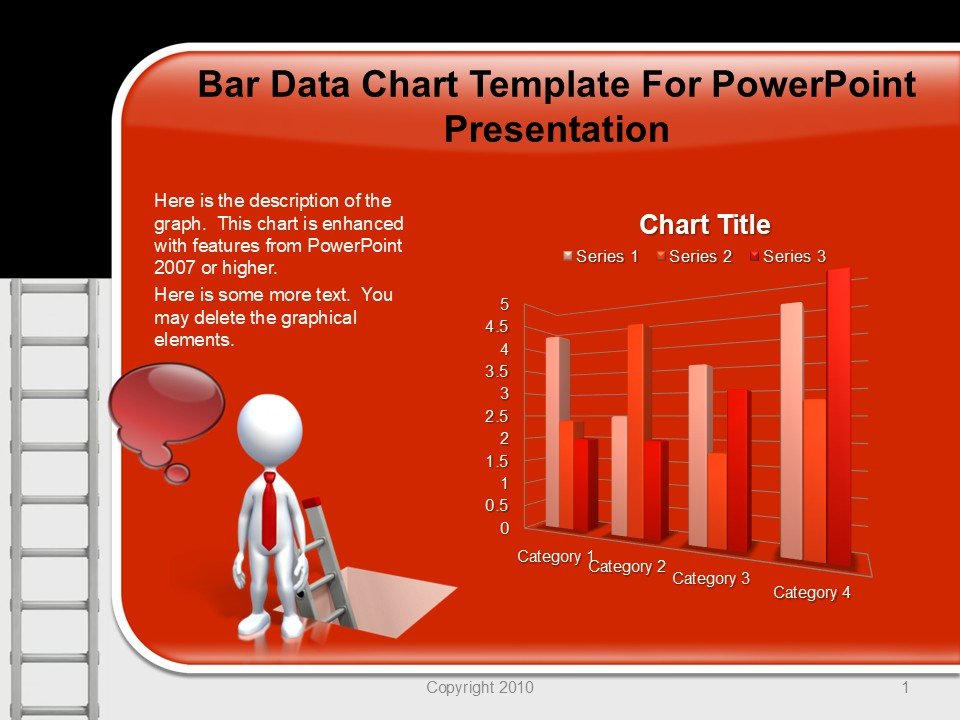
Tailored specifically for use in PowerPoint, this PPT slide template contains a variety of bar chart designs that can be adapted to suit different types of data presentations. Whether you are an educator illustrating student performance statistics, a business analyst reporting on quarterly sales data, or an advocate showcasing survey results to drive a campaign, the Bar Data Chart Template For PowerPoint Presentation PPT template is engineered to enhance your presentation’s clarity and impact.
The template’s design is clean and professional, making it suitable for corporate environments as well as educational settings. Each slide is crafted to ensure that your data stands out, with customizable options that allow you to adjust the color, size, and text to fit your specific needs. The user-friendly nature of this PPT template ensures that you can focus on your data without worrying about the aesthetics of your presentation.
Using the Bar Data Chart Template For PowerPoint Presentation PPT slide, you can transform raw data into compelling bar charts that communicate your message powerfully and succinctly. This presentation template is an essential tool for anyone who needs to present data in a format that is both informative and easy to understand.
Features:
– Fully editable templates: Customize every element of the slides with ease.
– High-quality visuals: Ensures that charts are clear and professional.
– Versatile design: Suitable for a wide range of presentation contexts.
– Easy to use: Minimal PowerPoint skills required to modify the templates.
– Compatibility with PowerPoint: Seamlessly integrates with the latest versions of PowerPoint.
Use Cases:
– Ideal for educators presenting student performance data.
– Crucial for business meetings to report financial statistics.
– Effective for non-profit organizations to display survey results.
– Useful for government presentations on statistical data related to public policies.
– Suitable for healthcare professionals illustrating patient data trends.


There are no reviews yet.