

Description
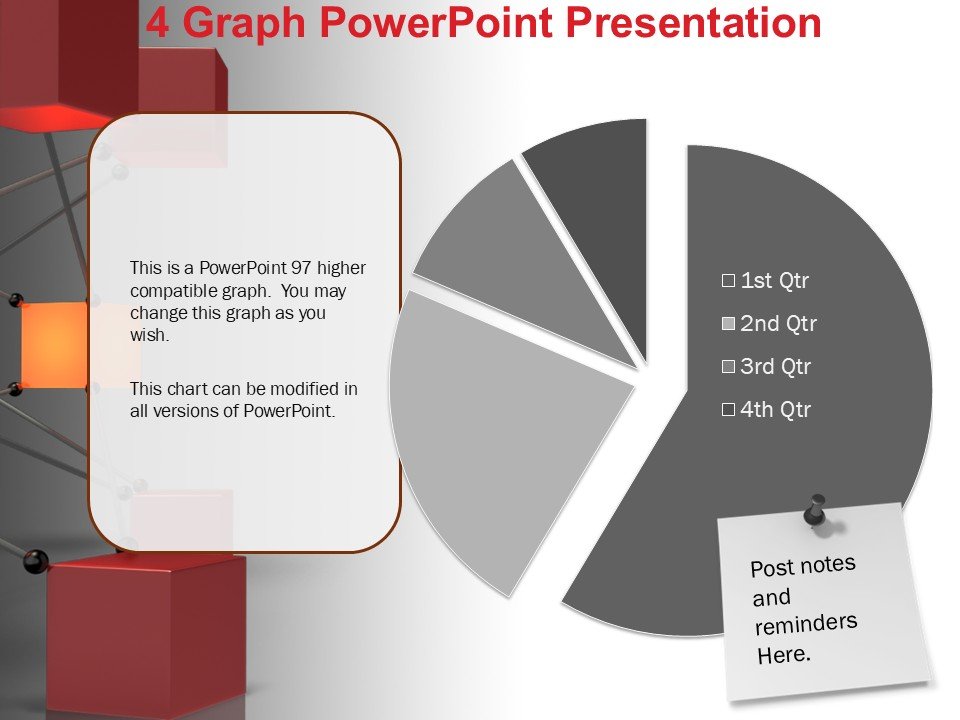
The 4 Graph PowerPoint Presentation PPT template is meticulously crafted to cater to professionals, educators, and advocates who require accurate and visually appealing graphic representations for their data-intensive presentations. This specialized PPT slide template allows users to effectively communicate complex information through clean, well-designed graphical elements, ensuring that every dataset is presented clearly and compellingly.
Tailored specifically for those who need to showcase data comparisons, trends, or growth patterns, the 4 Graph PowerPoint Presentation slide template is an invaluable resource. Whether you are a business analyst presenting annual financial trends, a researcher showing the latest scientific data, or an educator explaining statistical concepts, this PPT template provides you with the tools necessary to create impactful and understandable presentations.
The design integrates seamlessly into professional and academic presentations, with a focus on making quantitative data accessible and engaging. The template features four distinct graph styles that can be used to depict various data types, from bar graphs to line charts, each designed to enhance the viewer’s understanding of the material. The layout of each slide has been thoughtfully considered to ensure that textual content and graphical data complement each other without overwhelming the audience.
Moreover, the 4 Graph PowerPoint Presentation PPT template is designed with adaptability in mind. It is perfect for use across various fields such as economics, healthcare, education, or environmental science, making it a versatile choice for a wide range of applications. The professional yet straightforward aesthetic ensures that it can be integrated into any presentation without clashing with existing branding or visual themes.
In summary, this presentation template is an essential tool for anyone needing to convey data-rich content in a clear, effective, and aesthetically pleasing manner. It supports your goal to educate, inform, and persuade your audience with solid data and professional visuals.
Features:
– Fully editable templates: Customize every element of the slides with ease.
– High-quality graphics: Ensures clear visuals at any resolution.
– Versatile graph types: Includes bar charts, line graphs, pie charts, and histograms.
– Compatibility with PowerPoint: Designed to work smoothly with Microsoft PowerPoint.
– Easy to integrate: Seamlessly blends into your existing presentations.
– Professional design: Suitable for corporate, academic, and non-profit presentations.
Use Cases:
– Ideal for business presentations needing detailed financial analysis.
– Suitable for academic lectures or seminars on statistical analysis.
– Useful for healthcare professionals presenting patient data or research findings.
– Essential for environmental scientists and advocates presenting research on climate change.
– Beneficial for market researchers analyzing consumer behavior trends.


There are no reviews yet.