

Description
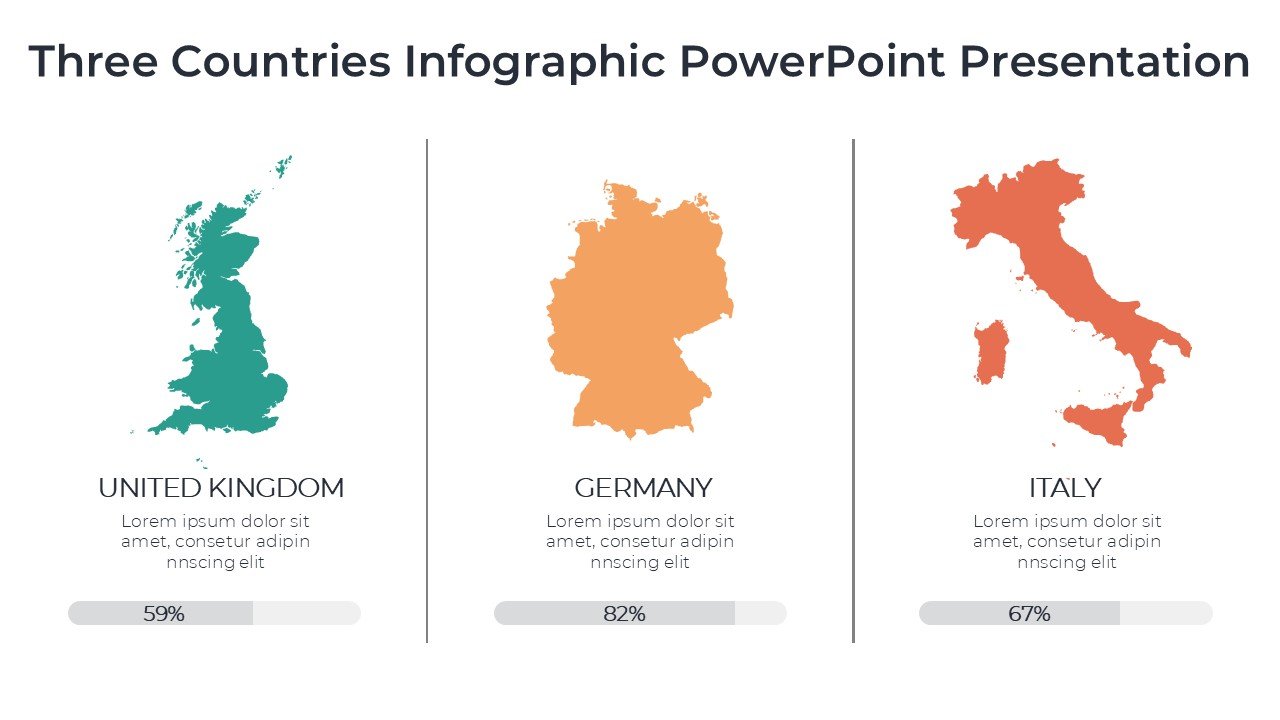
The Three Countries Infographic PowerPoint Presentation PPT template is an expertly designed slide template tailored for educators, professionals, and advocates seeking to present comparative data across three nations effectively. This engaging and visually appealing PPT template enables users to convey complex information in a simplified and accessible format, making it ideal for academic, corporate, and advocacy settings.
Crafted with precision, the Three Countries Infographic PowerPoint Presentation slide template includes a series of customizable slides that highlight key indicators such as demographics, economic data, health statistics, and more for three distinct countries. The design integrates maps, charts, and infographic elements that are not only easy to understand but also capture and retain the audience’s attention.
This PPT slide template is perfect for those who need to present comparative analyses, showcase trends over time, or highlight differences and similarities between countries in a visually compelling way. Whether you are a teacher illustrating different cultural contexts, a business analyst comparing market potentials, or an NGO worker advocating for global issues, this presentation template delivers your message with clarity and impact.
The Three Countries Infographic PowerPoint Presentation PPT template is designed to be intuitive and user-friendly, ensuring that anyone, regardless of their technical expertise, can customize it to fit their specific needs. The template’s flexibility and ease of use make it an invaluable resource for presenting data-driven insights and fostering a deeper understanding of global issues.
Features:
– Fully editable templates: Customize every element of the slides with ease.
– High-quality visuals: Includes maps, charts, and infographics to enhance presentation appeal.
– Cross-platform compatibility: Works seamlessly with both PowerPoint and Google Slides.
– Wide range of infographic elements: Utilize various graphical tools to represent data effectively.
– Quick and easy customization: Simple drag-and-drop placeholders for swift personalization.
Use Cases:
– Ideal for educators teaching international relations, geography, or global economics.
– Essential for business analysts comparing international markets or investment opportunities.
– Useful for NGOs presenting reports or data on international development issues.
– Beneficial for governmental agencies or diplomats preparing briefs on international affairs.
– Suitable for conference presentations focusing on global trends, health statistics, or economic conditions.
There are no reviews yet.