

Description
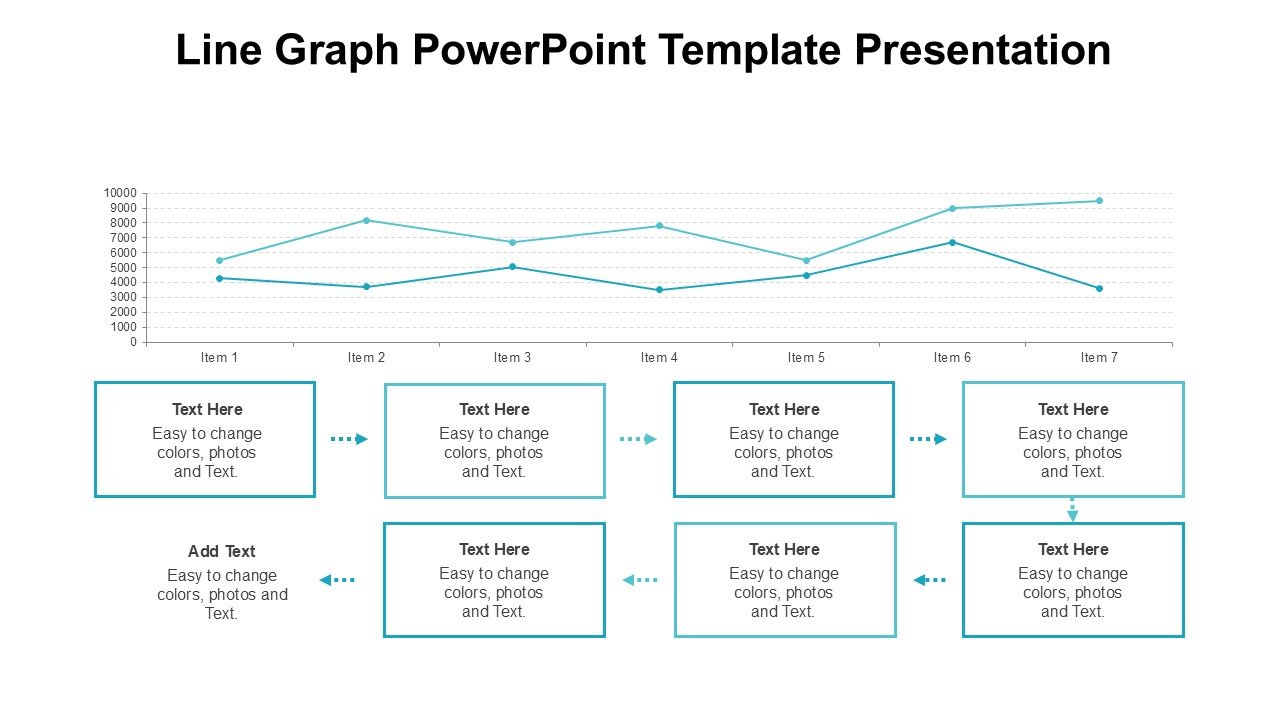
The Line Graph PowerPoint Template Presentation PPT template is meticulously designed to cater to educators, business professionals, and advocates who need to present data in a clear, visually appealing manner. This powerful PPT slide template transforms complex data sets into understandable, engaging visual representations, making it easier for audiences to grasp trends, progress, or results over time.
Created with versatility in mind, the Line Graph PowerPoint Template Presentation slide template serves a wide array of users, from teachers illustrating statistical trends to business analysts reporting on quarterly sales growth. The template is crafted to support presentations that require a visual display of data to communicate information effectively and persuasively.
Each slide within the Line Graph PowerPoint Template Presentation PPT template is designed for clarity and impact, ensuring that your data not only stands out but tells a compelling story. The template features a range of line graph styles—from simple, clean lines to more complex, multi-variable graphs. This variety allows presenters to select the most appropriate graph style that best fits the data and presentation context.
To further enhance the usability of the Line Graph PowerPoint Template Presentation slide template, it comes equipped with customizable elements. Presenters can easily adjust colors, fonts, and line styles to align with their branding or presentation theme. The ease of customization ensures that each slide can be tailored to meet specific presentation needs while maintaining a professional and cohesive look.
Whether you are an educator trying to explain statistical concepts to students, a business professional tasked with showcasing performance metrics to stakeholders, or an advocate presenting trend data to support a cause, the Line Graph PowerPoint Template Presentation PPT template is an essential resource that can help you deliver your message with precision and elegance.
Features:
– Fully editable templates: Customize every element of the slides with ease.
– Wide range of line graph designs: Choose the perfect graph to represent your data.
– Customizable color schemes: Match your presentation’s theme or corporate branding.
– Easy to use and modify: User-friendly for beginners and professionals alike.
– High-quality visuals: Designed for clear display on all screen sizes and resolutions.
– Compatible with PowerPoint: Works seamlessly within the PowerPoint environment.
Use Cases:
– Ideal for educators teaching mathematical concepts or statistics.
– Essential for business professionals during quarterly business reviews or annual meetings.
– Beneficial for economists or market researchers analyzing trends.
– Useful for healthcare professionals tracking patient recovery statistics or disease trends.
– Appropriate for environmental scientists presenting climate change data or ecological studies.


There are no reviews yet.