

Description
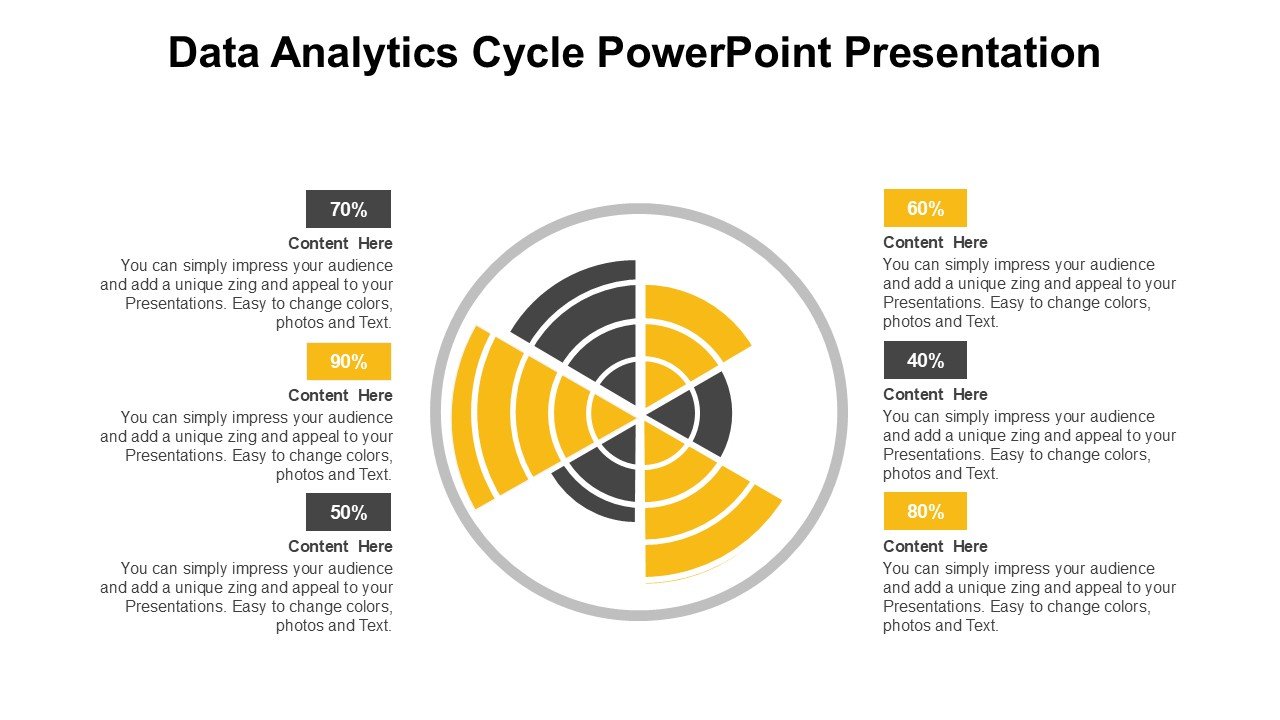
Unlock the potential of data with our Data Analytics Cycle PowerPoint Presentation slide template, designed meticulously to aid educators, professionals, and data advocates in illustrating the complex processes involved in data analytics. This PPT template is a comprehensive resource that guides you through each phase of the data analytics cycle, from data collection and processing to analysis and interpretation.
The Data Analytics Cycle PowerPoint Presentation PPT template is tailored to meet the needs of a diverse range of users, including data analysts, business strategists, educational instructors, and data-driven decision-makers. Whether you are presenting in a classroom, a boardroom, or a conference, this presentation template ensures that your audience grasps the nuances of data analytics through a clear, structured, and visually appealing format.
This PPT slide is not just a presentation; it’s a versatile toolkit that comes equipped with a variety of diagrams, charts, and models, all of which are essential for depicting data analytics processes. The slides are designed with an intuitive understanding that the audience might range from novice learners to seasoned professionals. Therefore, each slide is crafted to cater to varying levels of expertise and background, making complex data analytics concepts accessible and understandable.
The Data Analytics Cycle PowerPoint Presentation PPT template serves as an invaluable educational and professional asset. It employs a sophisticated yet user-friendly design palette, ensuring that the content is the hero. Diagrams and models are not only visually engaging but are also paired with ample text areas to allow for detailed explanations and insights. This ensures that your presentation not only captures attention but also educates and informs effectively.
Ideal for use in academic settings, corporate environments, or specialized data analytics seminars, this slide template is a must-have for anyone looking to convey the importance and methodology of data analytics in a coherent and impactful manner. The design and layout of the slides facilitate a logical flow of information, which helps in keeping the audience engaged and making the learning process smooth and effective.
Features:
– Fully editable templates: Customize every element of the slides with ease.
– High-quality graphics and visuals: Ensures clarity and engagement.
– Comprehensive slide deck: Covers all stages of the data analytics process.
– Easy to use and modify: Saves time and effort in preparation.
– Wide compatibility: Works seamlessly with PowerPoint and Google Slides.
– Professional and clean design: Keeps the focus on the content.
– Diverse slide formats: Includes charts, diagrams, and textual slides.
Use Cases:
– Ideal for teaching complex data analytics concepts in universities.
– Suitable for corporate training sessions on data-driven decision-making.
– Perfect for presenting research findings or case studies in conferences.
– Useful for workshops or seminars aimed at enhancing data literacy.
– Effective in strategy meetings to discuss data-oriented business strategies.


There are no reviews yet.