

Description
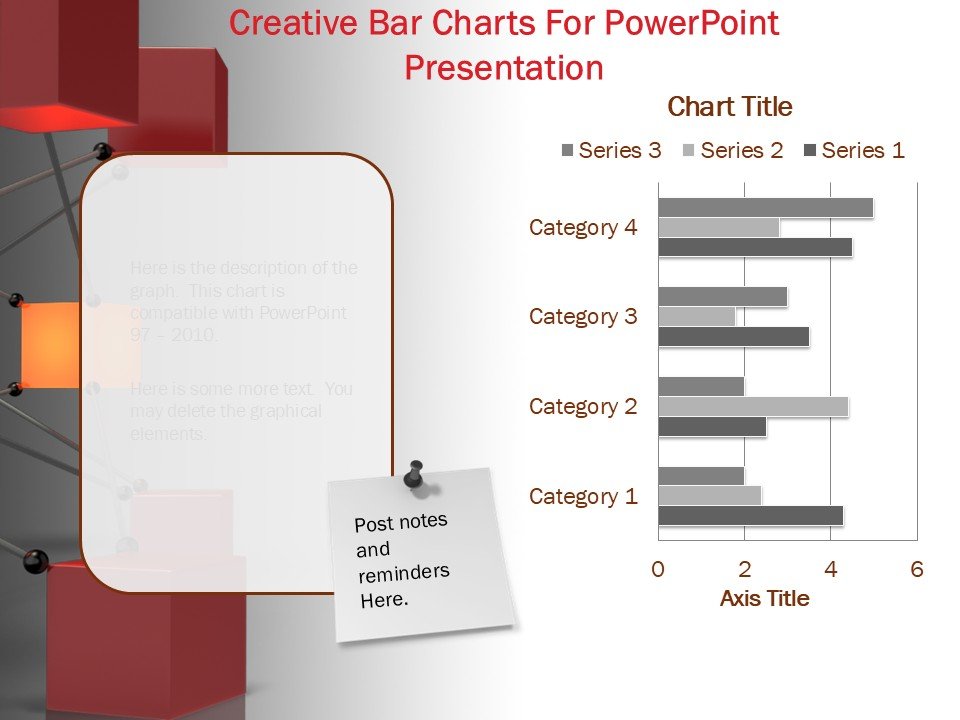
The “Creative Bar Charts For PowerPoint Presentation” slide template is an innovative and versatile PPT template designed to enhance the way you present data and statistics in your PowerPoint presentations. Tailored for educators, business professionals, and advocates, this presentation template transforms complex data into visually appealing and easy-to-understand bar charts that capture and retain the audience’s attention.
Understanding that clear and impactful data presentation is crucial in educational, professional, and advocacy settings, the “Creative Bar Charts For PowerPoint Presentation” PPT template offers a range of creatively designed bar charts. Each template is crafted to ensure that your data not only stands out but is also reflective of your unique style and message. Whether you are presenting market trends, educational results, or campaign outcomes, these PPT slides are engineered to make your data presentation as effective as possible.
This presentation template is not just about aesthetics; it’s about making data presentation more intuitive and engaging. With the “Creative Bar Charts For PowerPoint Presentation” PPT slide, presenters can customize each chart to align with specific presentation needs, making it a versatile choice for a wide array of industries and topics. The ease of use combined with high-quality design ensures that your presentations will look professional and polished, enhancing the overall impact of your message.
Ideal for anyone looking to upgrade their presentation game, this PPT template serves as a powerful tool in your arsenal to deliver compelling, data-driven stories. Whether you are a teacher aiming to illustrate student performance, a business analyst sharing financial forecasts, or an advocate outlining the statistical evidence of social issues, these slides are designed to help you communicate more effectively with your audience.
Features:
– Fully editable templates: Customize every element of the slides with ease.
– High-quality graphics: Ensures that visuals are crisp and engaging.
– Versatile design: Suitable for a range of presentation contexts.
– Easy to use: Simple drag-and-drop placeholders for quick customization.
– Wide compatibility: Works seamlessly with Microsoft PowerPoint.
– Diverse color schemes: Choose from various color options to match your presentation theme.
Use Cases:
– Ideal for educators presenting student performance metrics.
– Essential for business analysts showcasing market trends and financial data.
– Perfect for social advocates illustrating statistical evidence in presentations.
– Useful for HR professionals visualizing employee engagement statistics.
– Beneficial for health professionals explaining statistical health outcomes.
– Effective for marketing professionals demonstrating campaign results.


There are no reviews yet.