

Description
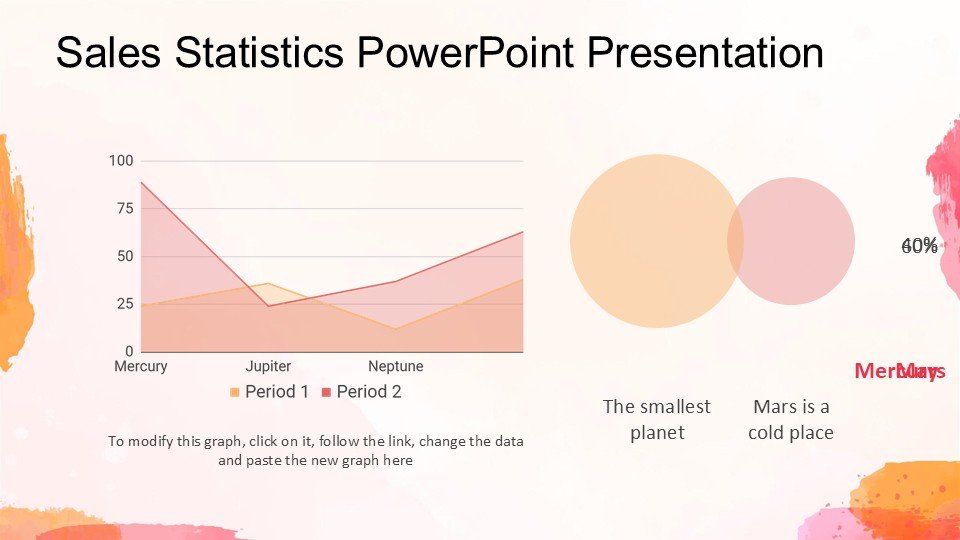
The Sales Statistics PowerPoint Presentation slide template is a meticulously designed PPT template crafted specifically for business professionals, sales analysts, and marketing strategists who aim to present sales data compellingly and clearly. This comprehensive presentation template serves as an essential resource for those looking to visualize sales trends, performance metrics, and analytical data to enhance strategic decision-making and improve sales outcomes.
With a focus on high-impact visuals and customizable content, the Sales Statistics PowerPoint Presentation PPT template offers a versatile solution for presenting complex sales data in an accessible format. Each slide within the PPT slide pack is designed to support effective communication, making it easier for sales teams, managers, and corporate executives to interpret data and derive actionable insights.
Whether you are preparing for a quarterly review, a strategy meeting, or a sales training session, this PPT template provides the tools necessary to create an engaging narrative around your sales data. The design is professional and sleek, suitable for corporate environments yet flexible enough to be tailored to more informal settings if required.
The layout of the Sales Statistics PowerPoint Presentation slide template is intuitive, ensuring that users can easily add their data and customize the aesthetics to fit their company’s branding or personal taste. Strategic use of charts, graphs, and tables in the template allows for a clear display of statistical information and trends, which are essential for making informed business decisions.
By using this presentation template, educators, professionals, and advocates can effectively convey the significance and implications of sales statistics to their audience, fostering a deeper understanding and encouraging a data-driven approach to sales management.
Features:
– Fully editable templates: Customize every element of the slides with ease.
– High-quality visuals: Charts, graphs, and tables designed to present data clearly and attractively.
– Professional design: Sleek, corporate look that is suitable for all business environments.
– Versatile usage: Easily adaptable layout and design to fit various presentation needs.
– Wide compatibility: Works seamlessly with Microsoft PowerPoint and other popular presentation software.
Use Cases:
– Ideal for corporate quarterly reviews and annual meetings.
– Suitable for sales training sessions to illustrate effective sales strategies.
– Useful for market analysis presentations at business conferences.
– Appropriate for educational purposes, such as teaching business students about sales data analysis.
– Effective for advocacy groups presenting data to stakeholders to highlight sales trends and successes.

There are no reviews yet.