

Description
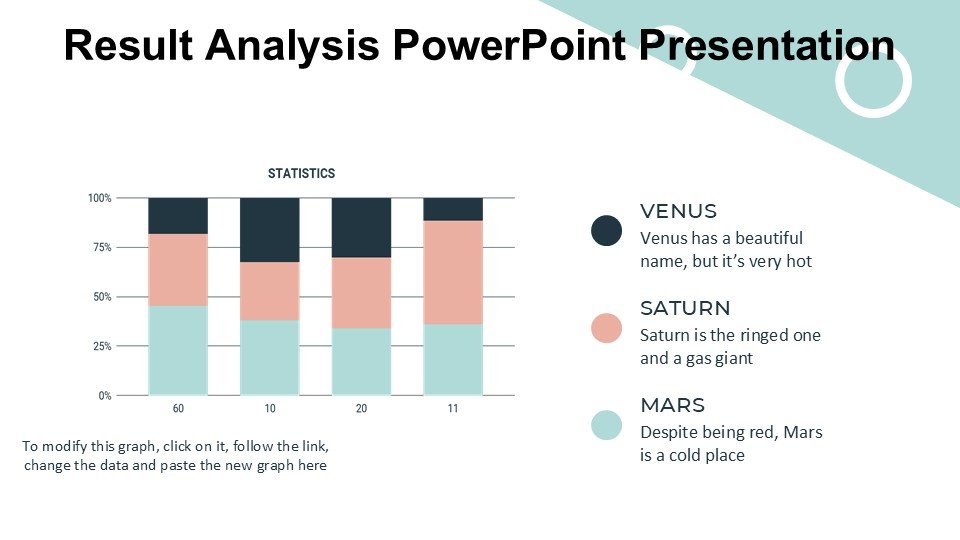
The Result Analysis PowerPoint Presentation slide template is an essential resource for educators, professionals, and advocates who are involved in the meticulous task of presenting and analyzing data outcomes. This comprehensive PPT template is designed to help you clearly and effectively communicate the results of various projects, experiments, or business metrics. Whether you are a teacher illustrating the success of educational interventions, a business analyst reporting on quarterly results, or a researcher presenting study findings, this presentation template is tailored to suit your needs.
Crafted with precision, the Result Analysis PowerPoint Presentation PPT template includes a range of slide designs that are not only visually appealing but also structured to enhance the viewer’s understanding of the presented data. Each slide is thoughtfully designed to accommodate graphs, charts, and textual analysis, ensuring that every piece of information is conveyed clearly and impactfully.
The template’s layout encourages a logical flow of information, making it easier for your audience to follow complex data interpretations and conclusions. The use of clean lines, readable fonts, and a professional color palette ensures that your presentation stands out while maintaining a formal tone suitable for academic, corporate, and non-profit environments.
Moreover, the Result Analysis PowerPoint Presentation PPT slide is fully customizable, allowing users to adapt the aesthetics and arrangement of information to meet specific presentation goals or organizational standards. This flexibility makes it an invaluable asset for anyone looking to create a detailed and persuasive data analysis presentation.
Features:
– Fully editable templates: Customize every element of the slides to fit your specific needs.
– Professional design: Engage your audience with visually appealing graphics and a coherent layout.
– Versatile slide formats: Includes slides for graphs, charts, text analysis, and summary conclusions.
– Wide compatibility: Works seamlessly with Microsoft PowerPoint and other popular presentation software.
– High-resolution visuals: Ensure your presentation looks sharp and professional on all screens.
Use Cases:
– Ideal for academic professionals presenting research findings or student performance data.
– Essential for business analysts and corporate leaders reporting on market trends or company performance.
– Useful for non-profit organizations assessing the impact of their programs or campaigns.
– Suitable for healthcare professionals analyzing clinical trial results or patient data trends.
– Beneficial for government agencies illustrating project outcomes or policy impacts.

There are no reviews yet.