

Description
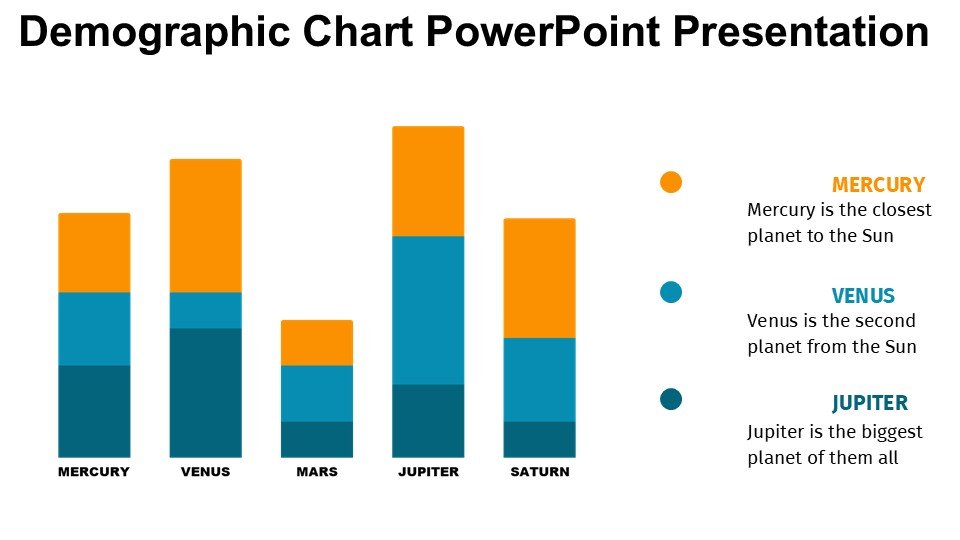
Introducing the Demographic Chart PowerPoint Presentation PPT template, an essential presentation template designed specifically for the visualization and analysis of demographic data. This PPT template is a comprehensive resource for educators, demographic researchers, market analysts, and policy advocates who need to present demographic information in a clear, visually engaging format. The Demographic Chart PowerPoint Presentation slide template offers a suite of slides tailored to display various demographic indicators such as age, gender, income, education level, and much more.
Whether you are preparing a presentation for a conference, a classroom lecture, or a strategic meeting, this PPT aims to enhance your ability to communicate complex demographic data effectively. The templates are crafted with precision and are meant to be user-friendly, ensuring that even those with minimal graphic design experience can create professional-quality presentations. The use of diverse chart types, from pie charts to bar graphs and line charts, allows for versatile representations of data, catering to different analytical needs and audience preferences.
Each slide in the Demographic Chart PowerPoint Presentation PPT template has been thoughtfully designed to not only present data but to tell a story. Color coding, editable legends, and annotated statistical data make it easier for the presenter to highlight key trends and demographic shifts. This is particularly useful in scenarios where making data-driven decisions and policies is crucial. The slide template is also an excellent tool for non-profits and governmental organizations aiming to educate the public or stakeholders about demographic changes and their implications.
The Demographic Chart PowerPoint Presentation is more than just a PPT slide; it is a powerful communication aid that transforms raw data into understandable and actionable insights. It is perfect for professionals seeking to influence decision-making processes, advocate for community needs, or simply educate students or the public about demographic trends.
Features:
– Fully editable templates: Customize every element of the slides with ease.
– Wide range of demographic chart types: Includes pie charts, bar graphs, histograms, and more.
– High-quality visuals: Professional design to enhance readability and viewer engagement.
– Compatibility with PowerPoint: Seamlessly operates within the Microsoft PowerPoint environment.
– Multi-purpose use: Suitable for various presentation contexts from academic to corporate.
– Downloadable and reusable: Use the template multiple times for different presentations.
Use Cases:
– Ideal for university lectures in sociology or human geography.
– Essential for market research presentations analyzing target customer demographics.
– Useful for policy-making presentations to local councils or government bodies.
– Beneficial for public health presentations detailing population health demographics.
– Supports NGO presentations focusing on demographic changes and their social impacts.
– Suitable for corporate presentations to outline potential market expansions or customer base changes.


There are no reviews yet.