

Description
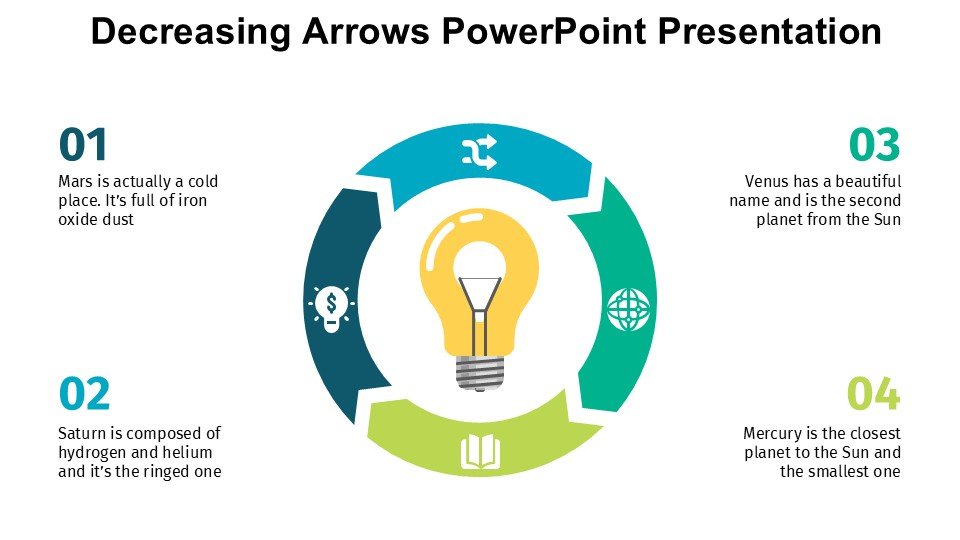
The Decreasing Arrows PowerPoint Presentation PPT template is an expertly designed slide template tailored for educators, business professionals, and advocates who need to create impactful presentations that communicate trends, declines, or step-by-step reductions in various contexts. This versatile PPT template features a series of creatively arranged arrows that visually represent decreasing sequences, making it an invaluable resource for presenting complex data in a clear and engaging manner.
Tailored to meet the needs of users who require a clear visual metaphor for decline or reduction, the Decreasing Arrows PowerPoint Presentation slide template is perfect for illustrating financial downturns, educational scoring trends, environmental degradation statistics, or any scenario where downward trends need to be highlighted. The design is sleek and professional, ensuring that it can be integrated seamlessly into corporate presentations, academic lectures, or advocacy campaigns.
This presentation template is not only a visual aid but also a comprehensive tool for storytelling in presentations. Each slide is crafted to allow for easy customization, enabling users to adapt the design to fit their specific message or data. The Decreasing Arrows PowerPoint Presentation PPT template is designed to be intuitive for users at all tech levels, from PowerPoint beginners to seasoned professionals, ensuring that anyone can effectively convey their message with sophistication and clarity.
Whether you’re a teacher explaining educational theories, a business analyst reporting on market trends, or an advocate presenting data on social issues, this PPT slide template will enhance your ability to communicate effectively with your audience. The design accommodates a wide range of industries and can be used in various professional scenarios, making it a versatile addition to any presentation toolkit.
Features:
– Fully editable templates: Customize every element of the slides with ease.
– High-quality visuals: Crisp and clear graphics to enhance your presentation.
– Versatile design: Suitable for multiple industries and presentation types.
– Easy to integrate data: Compatible with charts, graphs, and other informational graphics.
– Wide compatibility: Works seamlessly with all versions of PowerPoint and other presentation software like Google Slides.
Use Cases:
– Ideal for financial analysts illustrating market trends and economic declines.
– Suitable for educators teaching concepts that involve decreases, such as population studies.
– Essential for environmentalists showcasing data on topics like deforestation or pollution.
– Helpful for business managers reporting on sales, revenue, or performance declines.
– Beneficial for public health officials presenting statistics on disease reduction or control efforts.


There are no reviews yet.