

Description
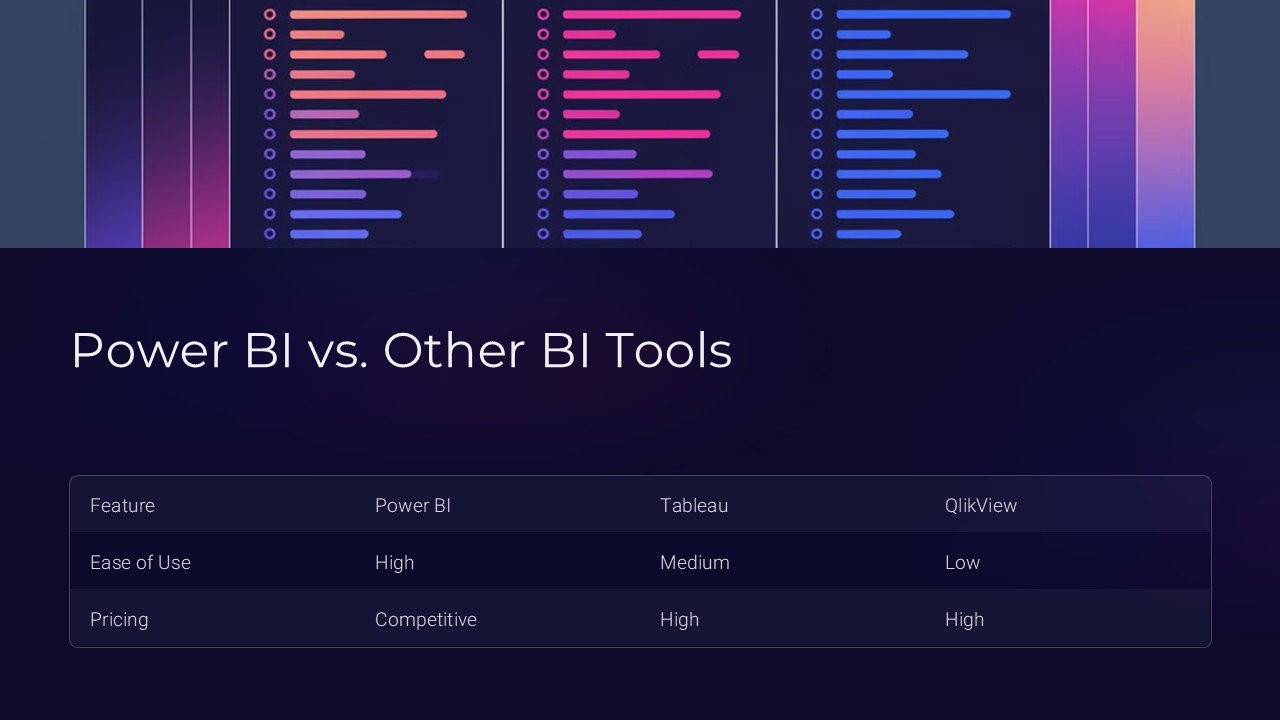
**Power BI vs. Other BI Tools PowerPoint Presentation**
In today’s data-driven business environment, choosing the right Business Intelligence (BI) tools is crucial for strategic decision making. Our comprehensive PowerPoint presentation on “Power BI vs. Other BI Tools” provides a detailed comparison designed to help professionals understand the strengths and weaknesses of Microsoft Power BI in the context of other leading BI software. This presentation is ideal for IT professionals, data analysts, and business managers who are evaluating or considering their options in BI tools.
This meticulously crafted presentation begins with an introduction to Business Intelligence, explaining its importance and the role it plays in helping businesses make informed decisions. We then dive deep into a comparative analysis of Microsoft Power BI, one of the most popular BI tools, against other significant players in the market such as Tableau, QlikView, and SAS.
Key comparisons are made on various parameters including integration capabilities, ease of use, visualization techniques, data connectivity, performance, scalability, and cost-effectiveness. Each slide is designed to provide clear, concise, and factual information, backed by the latest research and case studies which illustrate real-world applications and outcomes.
One of the standout features of this presentation is its interactivity and visual appeal. The fully editable templates ensure that you can tailor the content to better suit your specific needs or focus areas. Whether you need to add more data points, alter the designs, or integrate your company branding, the flexibility is at your fingertips.
**Features of the Presentation:**
1. **Fully Editable Templates:** The slides are completely customizable. You can easily change colors, text, and graphics to match your corporate style or to highlight specific data points crucial for your analysis.
2. **Supports PowerPoint and Google Slides:** No matter which platform you are comfortable with, our presentation is ready to use with both Microsoft PowerPoint and Google Slides, ensuring seamless compatibility and ease of use.
3. **Comprehensive Data Comparison:** Each tool is evaluated on critical performance metrics with side-by-side comparisons for a clear, visual representation. This aids in quickly understanding the advantages and limitations of each tool.
4. **Current and Relevant:** Updated with the latest trends and data, the presentation includes the most recent updates in the world of BI tools. This ensures that you are making decisions based on the most current information available.
5. **Professional Visuals:** From high-quality charts and infographics to professional layouts, each slide is crafted to not only provide information but to hold the audience’s attention and facilitate better understanding through visual storytelling.
6. **User-friendly Notes:** Each slide contains speaker notes to guide the presenter through each topic, making it easier to deliver a powerful and effective presentation, even if you are not a subject matter expert on BI tools.
Whether you’re hosting a team meeting, conducting a workshop, or making a decision about which BI tool to implement in your organization, the “Power BI vs. Other BI Tools PowerPoint Presentation” is an invaluable resource that will guide you through the complex landscape of Business Intelligence tools with clarity and insight.


There are no reviews yet.