

Description
**Introducing the Power BI Desktop PowerPoint Presentation: A Comprehensive Guide for Effective Data Visualization and Analysis**
Unlock the full potential of data visualization with our detailed PowerPoint presentation on Installing and Navigating Power BI Desktop. This presentation is meticulously designed to guide users through the fundamental steps of setting up Power BI Desktop, as well as expertly navigating its robust features for transformative data analysis. Whether you are a beginner eager to dive into the world of data or an experienced analyst looking to enhance your visualization skills, this presentation serves as your essential companion.
**Engaging and Informative Slides**
Each slide in this PowerPoint presentation is crafted with attention to clarity and visual appeal to ensure that all concepts related to Power BI Desktop are communicated effectively. From the initial installation steps to more complex functionalities like importing data and creating interactive reports, our presentation covers all the necessary ground in a format that’s easy to understand and visually engaging.
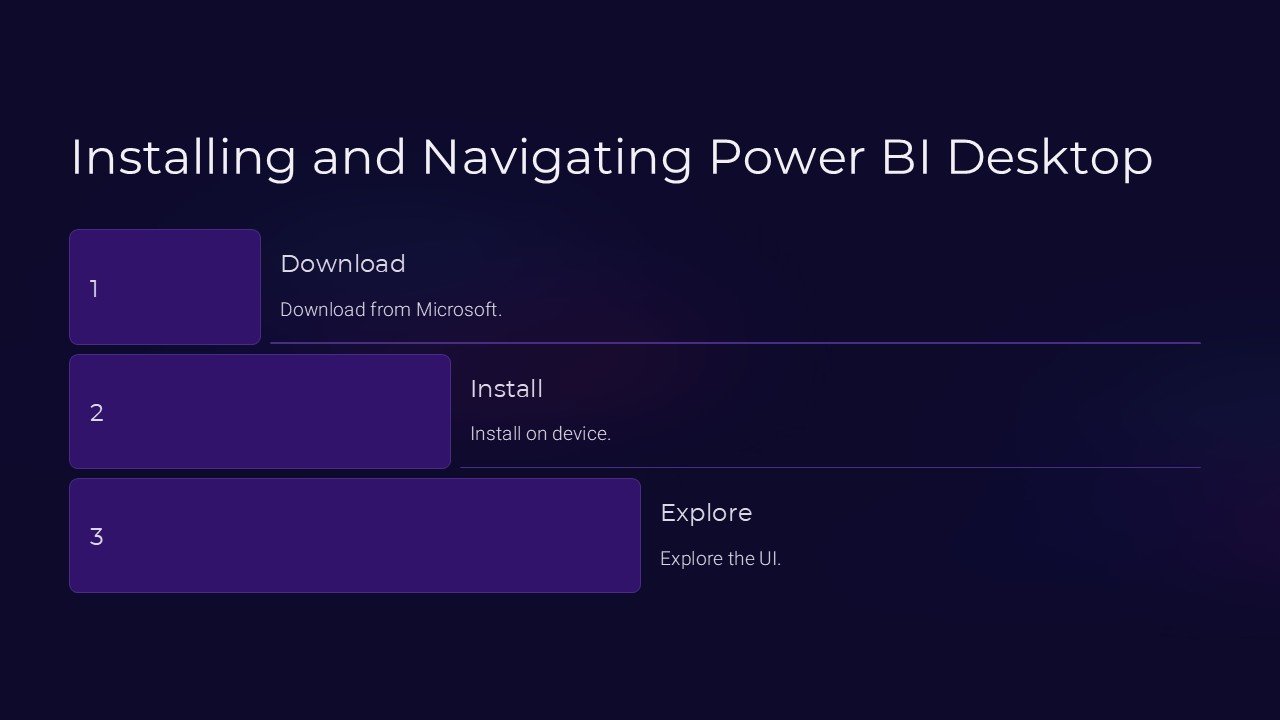
**Step-by-Step Installation Guide**
Embark on your Power BI journey with a comprehensive slide that outlines every step of the installation process. This section ensures that even users who are new to software installations can easily set up Power BI Desktop on their computers without hassle. The guide includes system requirements, download instructions, and initial setup configurations.
**Navigating the Power BI Desktop Interface**
Once installation is complete, our presentation takes you on a tour of the Power BI Desktop interface. Learn about the various menus, toolbars, and panels available, and how to navigate through them to maximize your data analysis efficiency. This section is designed to make you comfortable and familiar with the interface, paving the way for a smooth analytical workflow.
**Creating and Customizing Reports**
Discover the power of creating insightful and impactful reports with Power BI Desktop. Our slides detail the process of dragging and dropping elements to craft visually appealing reports. Learn how to customize these reports with filters, slicers, and other tools to make your data speak volumes and support decision-making processes in your organization.
**Connectivity and Data Importation Techniques**
Power BI Desktop connects to a variety of data sources. Our presentation includes slides that explain how to connect to databases, import spreadsheets, and even pull data from cloud services. This section ensures you can bring all your necessary data into Power BI for comprehensive analysis.
**Interactive and Dynamic Updates**
Experience the dynamic capabilities of Power BI Desktop with our slides that showcase how to make your reports interactive. Learn how to use bookmarks, tooltips, and Q&A features to make your reports not just informative but also interactive, allowing end-users to explore data in a very hands-on manner.
**Fully Editable Templates**
This PowerPoint presentation is fully editable, allowing you to tweak the content to better suit your specific needs or to align with your corporate branding. The templates are compatible with both PowerPoint and Google Slides, ensuring versatility and ease of use across different platforms.
**Conclusion**
With the Installing and Navigating Power BI Desktop PowerPoint Presentation, mastering the art of sophisticated data analysis is just a slide away. Ideal for training sessions, workshops, or even self-learning, this presentation is a valuable resource for anyone looking to enhance their analytical capabilities with Power BI Desktop. Equip yourself with the knowledge to transform raw data into compelling stories and actionable insights today!


There are no reviews yet.