

Description
**Introducing the Identifying Trends and Patterns PowerPoint Presentation**
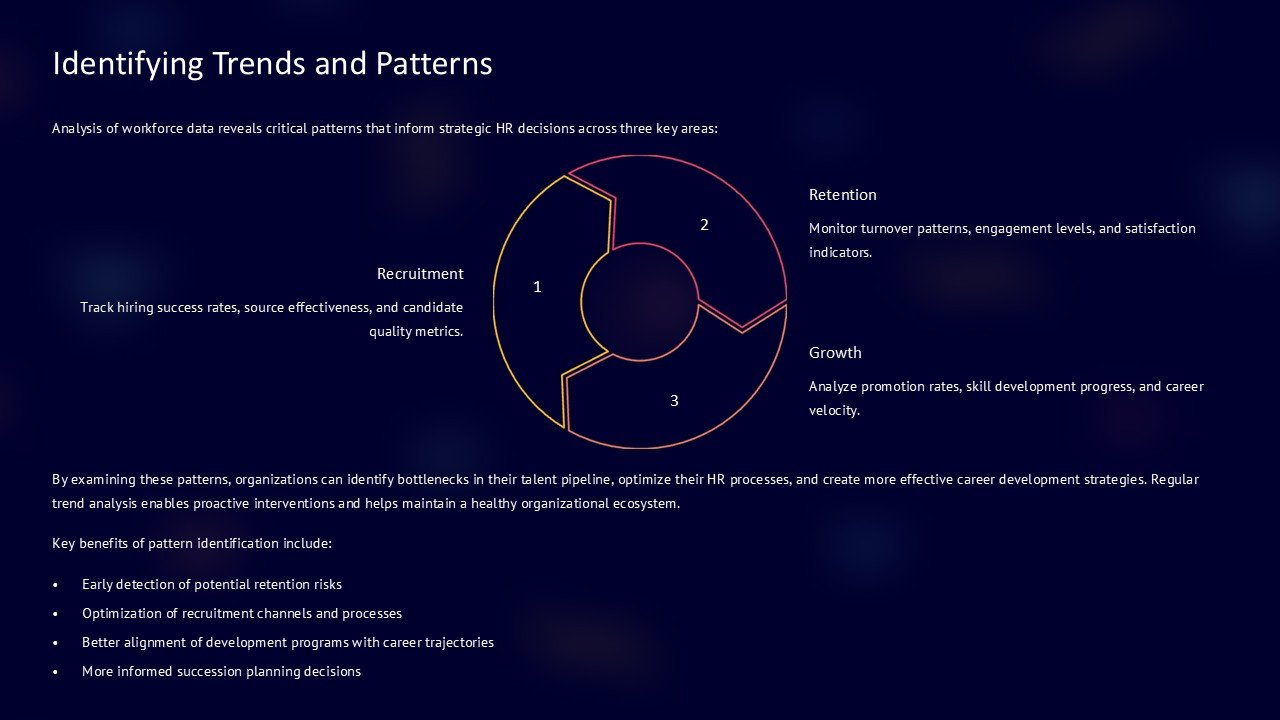
In today’s data-driven world, the ability to discern trends and patterns is invaluable. Our Identifying Trends and Patterns PowerPoint Presentation is a meticulously designed toolkit that empowers professionals across industries to unlock insights from data visually and effectively. This comprehensive presentation is tailored to aid in the visualization of complex data, helping you make informed decisions and strategic moves in your business or research endeavors.
Crafted with precision, this PowerPoint presentation includes a variety of slides that cater to different aspects of data analysis. Each slide is designed to highlight trends, showcase patterns, and allow for a clear display of chronological data changes. Whether you’re presenting market research, financial forecasts, consumer behavior analytics, or scientific data, this presentation will serve as your ultimate guide to making your data comprehensible and impactful.
The Identifying Trends and Patterns PowerPoint Presentation is not just a tool but a transformational asset that enhances your ability to communicate complex information in an accessible format. The slides are arranged logically, guiding the viewer through a narrative that begins with broad data introduction and moves towards more detailed analyses. This progression ensures that your audience grasitates the full scope and significance of the data presented.
**Features of the Identifying Trends and Patterns PowerPoint Presentation:**
1. **Fully Editable Templates**:
– Every slide in this presentation is fully editable, allowing you to customize the look and feel according to your needs and branding guidelines. You can change colors, modify text, adjust backgrounds, and add images as required, making each presentation uniquely yours.
2. **Compatibility with PowerPoint and Google Slides**:
– Designed for versatility, the presentation is compatible with both Microsoft PowerPoint and Google Slides. This feature ensures that you can create, edit, and present using your preferred platform without worrying about format compatibility issues.
3. **Diverse Slide Designs**:
– The presentation includes a range of slide designs, from graphs and charts to text-based slides and image placeholders. This diversity allows for a dynamic presentation that maintains audience engagement throughout.
4. **Infographic Elements**:
– Utilize various infographic elements that are included to help illustrate the data points and trends clearly. These visual tools are crucial for making abstract data tangible to your audience.
5. **High-Quality Visuals**:
– All graphical elements are designed with high resolution to ensure that they look sharp and professional on both big screens and small handouts. No more blurry images or unreadable text; everything is crafted for clarity and impact.
6. **User Guide and Support**:
– The presentation comes with a detailed user guide that provides instructions and tips on how to customize and maximize the use of each slide. Additionally, customer support is available to assist you with any specific queries or issues you might encounter.
The Identifying Trends and Patterns PowerPoint Presentation is an essential tool for analysts, marketers, researchers, and business leaders. It assists in transforming raw data into a powerful narrative that not only tells a story but also drives decision-making. Elevate your presentations and convey data with confidence and clarity with this expertly designed PowerPoint template.


There are no reviews yet.