


Description
Introducing the Enhanced Data Visualization PowerPoint Presentation, a cutting-edge tool designed to transform complex data sets into captivating, easy-to-understand visual displays. This premium presentation template is tailored to meet the needs of professionals across various industries, including business analysts, data scientists, marketers, and educational theorists who are keen on presenting their data with clarity and precision.
The Enhanced Data Visualization PowerPoint Presentation stands out with its comprehensive suite of meticulously designed slides, each tailored to showcase data effectively. Whether you’re looking to present market trends, annual statistics, or case study findings, this template ensures that your data not only stands out but tells a compelling story.
Key Features:
1. **Fully Editable Templates:** Each slide is fully editable, allowing you to customize the layout, colors, and text to fit your specific needs. This flexibility ensures that no matter your data or audience, your presentation will always look polished and professional.
2. **Wide Variety of Charts and Graphs:** The template includes a diverse array of chart types, including bar graphs, pie charts, line charts, scatter plots, and more. Each chart is designed to be visually appealing and easy to interpret, ensuring that your audience can follow along without confusion.
3. **Compatibility with PowerPoint and Google Slides:** To cater to different user preferences and technical setups, this presentation is compatible with both Microsoft PowerPoint and Google Slides. This dual compatibility ensures that you can create, edit, and present your data visualizations from virtually any device or platform.
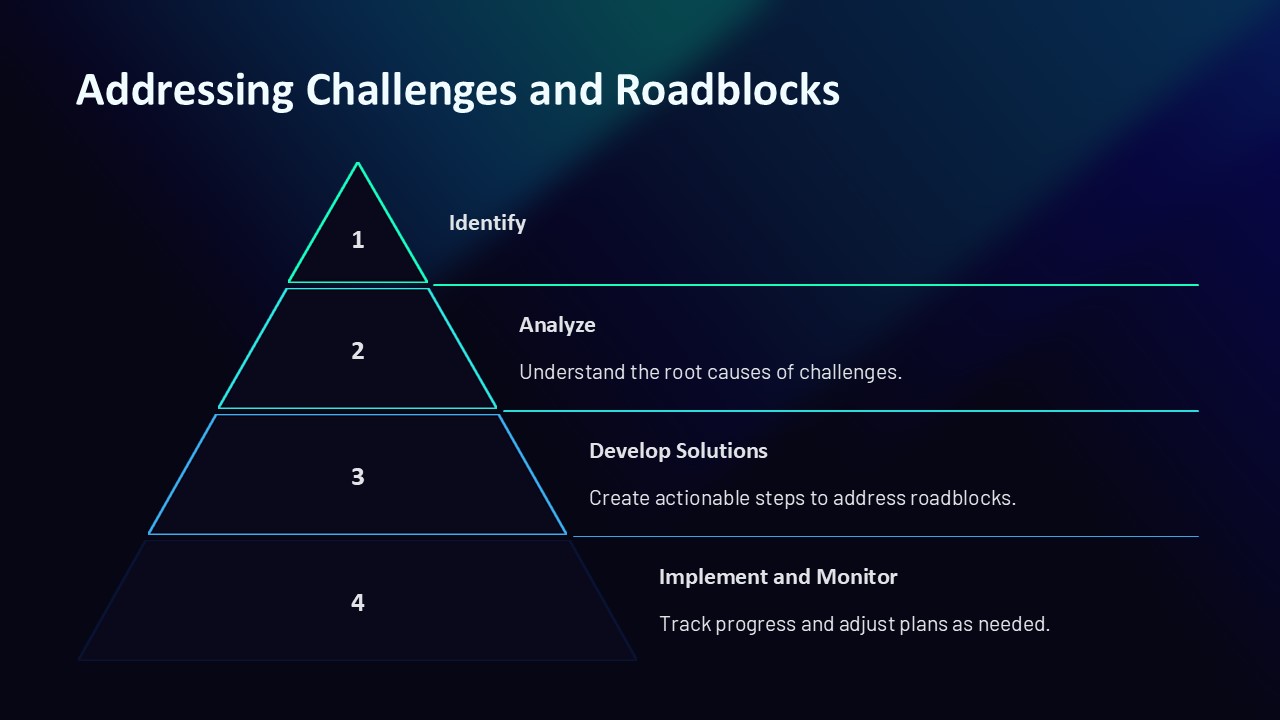
4. **Dynamic Infographics:** Elevate your data presentation with our range of dynamic infographics. These are not only visually engaging but are also designed to make sequential or complex information more digestible for your audience.
5. **Customizable Color Schemes:** Choose from a variety of built-in color schemes, or create your own to match your company branding or presentation theme. This feature allows for a personalized touch that can make your presentation stand out in the minds of your viewers.
6. **Professional Design Aesthetics:** With a focus on modern design principles, the slides in this template are crafted to be sleek and professional. This ensures that your presentation will always have a contemporary look and feel, suitable for formal business environments or academic settings.
7. **Easy to Follow Layouts:** The layouts are designed to guide the viewer’s eye across the screen naturally, making the data easier to follow and understand. Strategic use of space and typography enhances readability and audience engagement.
Whether you’re a seasoned data analyst or a business professional looking to make your next pitch more impactful, the Enhanced Data Visualization PowerPoint Presentation is your go-to solution for making data-driven points clearly and persuasively. Transform your raw data into a powerful visual story that captivates and informs. With this tool, your presentations will not only deliver insights but will also leave a lasting impression on your audience.


There are no reviews yet.